Trend Surface
![]()
Trend surface analysis is the mathematical process of separating sample data into its regional and local components. A trend or drift in a set of sample data implies a slow, large scale directional change in the expected value over the study area. Before such data can be modelled by standard geostatistical methods, it must be modified.
The purpose of the calculation is to detect and remove trends from the sample data set. This must be done for two reasons:
- Semi variogram models are only valid when calculated using data which does not exhibit a trend.
- To proceed with 3D Kriging, we must provide the semi variogram of the residual variation, plus an indication of the type of trend we expect to find.
The program performs a polynomial trend surface analysis using the least squares method. It calculates a contour grid using the raw data, then fits a planar (linear), quadratic (dome or bowl), and a cubic (saddle point) surface to the contoured data. When you run the display, you can view any of these surfaces fitted to your data and choose the one that fits best.
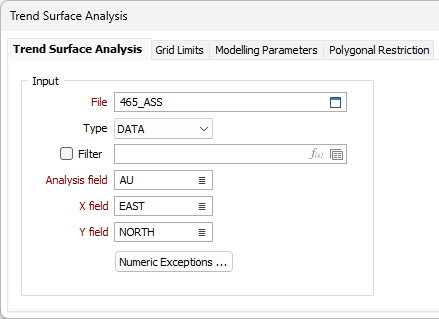
Input
File
Select a file Type and double-click (or click on the Select icon) to select the name of the source File. You can also click the Pick from Vizex button to collapse the form and interactively select a layer containing the file to be inserted and return to the form.
If required, define a Filter to restrict the process to a subset of the records in the file.
Analysis, X and Y fields
Select the field on which the analysis will be performed and define which fields in the data file will represent the X, Y directions.
Numeric Exceptions
(Optionally) Use the Numeric Exceptions group to control the way that non-numeric values are handled. Non-numeric values include characters, blanks, and values preceded by a less than sign (<).
Output
Stats and Data files
In addition to the contour display, the process calculates, and saves to file, a set of statistics that can help you decide which surface best fits your data. It also saves a data file containing the output data from the function - including residuals.
Enter suitable names for the Output.
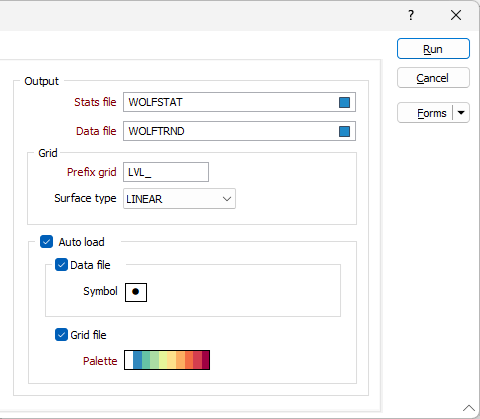
Grid
A contour grid is used to identify the underlying trend of the data. It is created when you run the trend surface analysis. The contours are derived using values calculated for each block of an array that covers the display limits of the data.
Prefix grid
Enter a prefix to identify the contour layers generated from the input data.
Surface type
A LINEAR, QUADRATIC or CUBIC equation may be used to describe the trend in the data. The option you select here will determine the default for the contours displayed in Vizex.
Auto load
Select the Auto load check box to display the data points and contour grids in Vizex once the analysis is complete.
Data file
When this check box is selected, the raw data used to calculate the contours will be displayed as points. Select the point symbol that will be used to designate each point.
Grid file
When this check box is selected, the default surface grid will be displayed. Select the palette that will be used to render the grid contours.
Palette
The colours you assign to the ranges in a colour set or a hatch set can be saved as a palette, which is simply a list of RGB colour values. These palettes - and other default system palettes - are available for selection when you click the Select button in the Edit Colour Set or Edit Hatch Set form.
Double-click on the Palette box to choose a palette. You can also right-click on the box to see a preview of the current palette.
Forms
Click the Forms button to select and open a saved form set, or if a form set has been loaded, save the current form set.
Run
Click the Run button to run the process. See: Auto Load