Auto Load
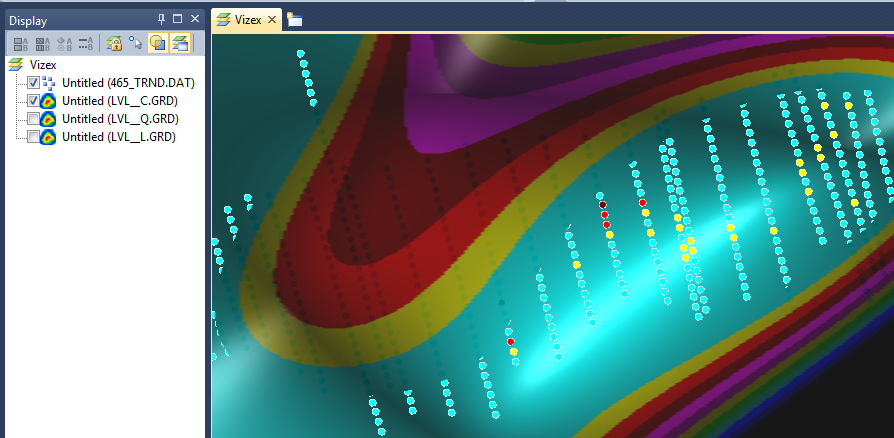
If you have chosen to auto load the output files, the data and the contour grid generated by the process are displayed in Vizex. Depending on the output options you have chosen, a point layer and a grid layer for each (Linear, Quadratic, Cubic) equation is displayed.
The equation you have chosen to display (on the Display tab of the Trend Surface form) will be the one displayed by default. You can switch the display between the three types of trend surface by simply selecting the appropriate check boxes in the Vizex Layer Display pane.
Evaluating the trend surface display
Take care when you evaluate how well a trend surface fits. The program will fit surfaces to any data. Even completely random data can produce impressive Percentage of Total Sum of Squares values.
Initially you should check the graphic display closely. Pay particular attention to the number of data points with colours different to the trend colour in the same location. Points displayed in the same colour as that of adjacent trend intervals are of less concern than those displayed in colours two or more intervals removed. Points near a trend surface boundary will exhibit more difference than those central to the area.
It is useful to evaluate the residual values using histograms and probability plots. The mean of such variables will always be very close to zero but high standard deviations are warning signals.