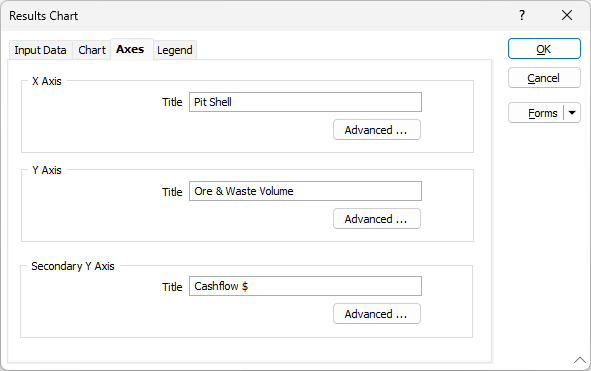
Axes
Use the Results Chart > Axes tab to specify the titles, and ranges, formats, fonts and colours for the values to be marked on, each axis of the chart.
XAML (Extensible Application Markup Language) can be used to apply formatting to the titles. For more information, refer to Chart Formatting and Mark-up Reference.
X Axis
Specify the following settings for the horizontal (X) axis of the chart:
Title
(Optional.) Specify the title for the horizontal axis of the chart.
Advanced
Click to display the Advanced Properties dialog box and specify the ranges, formats, fonts and colours for the values to be marked on the horizontal axis of the chart.
Y Axis
Specify the following settings for the left vertical (Y) axis of the chart:
Title
(Optional.) Specify the title for the left vertical axis of the chart.
Advanced
Click to display the Advanced Properties dialog box and specify the ranges, formats, fonts and colours for the values to be marked on the left vertical axis of the chart.
Secondary Y Axis
Specify the following settings for the right vertical (secondary Y) axis of the chart:
Title
(Optional.) Specify the title for the right vertical axis of the chart.
Advanced
Click to display the Advanced Properties dialog box and specify the ranges, formats, fonts and colours for the values to be marked on the right vertical axis of the chart.
See: Advanced