Chart
Use the Chart tab to specify the titles and select the visual theme for the chart, or to save an image of it for further editing or inclusion in a document.
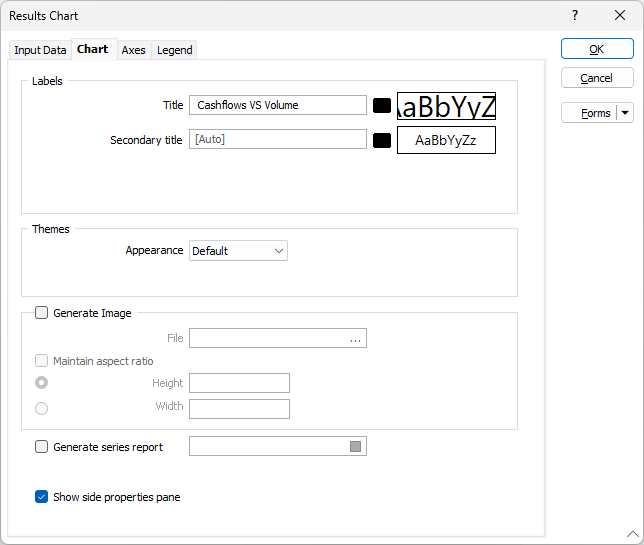
Labels
(Optional.) Specify the titles for the chart.
XAML (Extensible Application Markup Language) can be used to apply formatting to the titles. For more information, refer to Chart Formatting and Mark-up Reference.
Title
(Optional.) Specify the main title that is to be displayed at the top of the chart.
Secondary title
(Optional.) Specify the subtitle that is to be displayed underneath the main title at the top of the chart.
Themes
These options control the visual theme and colouring that is applied to the chart.
Appearance
Select the colouring to be applied to the chart.
Select Black to set the background of the chart to black. The other options affect the colour of the grid lines and the background colour of the legend.
Show legend
Select whether the legend for the chart is to be displayed.
The legend tabulates the colours and marker shapes that have been assigned to each data series. When selected, it will be displayed next to the top right corner of the chart.
Generate Image
Select to save an image of the chart for further editing or inclusion in a document.
File
Specify the name of the file in which the image of the chart is to be saved.
By default, the image will be saved in Portable Network Graphics (PNG) format and the .png extension will be appended to this name as required. However, all of the following formats are supported and can be selected by clicking the … button and setting the file type in the Select Output File dialog:
| Format | File Extension |
|---|---|
|
Portable Network Graphics |
.png |
|
Graphics Interchange Format |
.gif |
|
Windows Bitmap |
.bmp |
|
JPEG File Interchange Format |
.jpg |
Maintain aspect ratio
Select to ensure that the ratio of the width of the chart to the height of the chart in the saved image matches the corresponding ratio for the chart displayed on the screen.
When selected, the radio buttons for the Height and Width settings are enabled. Select whether you wish to specify the height or the width of the saved chart. The other dimension will be calculated to ensure that the aspect ratio of the displayed chart is maintained.
Height
Specify the height (pixels) for the saved image of the chart.
Width
Specify the width (pixels) for the saved image of the chart.