Shewhart Control Chart
Select Stats | Quality Control | Shewhart Control Chart to setup Shewhart Mean or Range charts.
Warning levels are drawn on the chart at one, two and three standard deviations, or for a user-defined Action level%. With an Action level% of 99.9, one point in forty can be outside Warning level two when a process is in control. Two successive points outside warning level two usually indicates that assignable causes of variation are present. Note that the symbols used to display each point vary according to where they point appear on the plot.
The points outside the warning and action limits are listed in a Property Window to the right of the display. A process that is out of control may be indicated in a number of ways, depending on the Rules you have applied to the process.
When you are trying to determine why the process has gone out of control, it is useful to study the chart looking for patterns that may provide some clues.
It is also useful to annotate either the printout of the chart or your sample database whenever there is a significant change in sample size, laboratory equipment changes, changes in methods, etc. Such notes become very useful when tracking assignable causes of variation.
When sample groups contain more than about ten samples, the range becomes an inefficient measure of variability. In this case you can split groups and calculate a mean for each. The size and frequency of sampling is, at least in part, an economic decision. Large groups, drawn frequently, offer good control data but are costly to generate.
Input Data
File
On the Input Data tab of the Shewhart Control Chart form, select a file type and then double-click (or click on the Select icon) to select the name of the file containing your data. You can optionally apply a filter to select a subset of the data in the file.
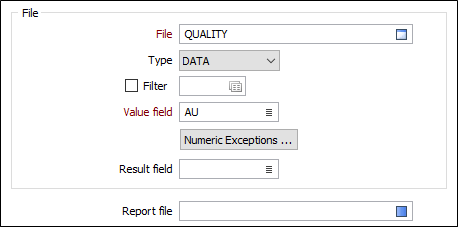
Value field
Double-click (or click on the Select icon) to select the name of the field where the sample values (or group means of the sample values) are stored.
Numeric Exceptions
(Optionally) Use the Numeric Exceptions group to control the way that non-numeric values are handled. Non-numeric values include characters, blanks, and values preceded by a less than sign (<).
Result field
Enter (or double-click to select the name of the field that reports which rules have failed per record. If the field does not exist in the file, it will be created.
Report file
Enter (double-click or click on the Select icon) to select the name of the Report File that will be written as a result of the process. To see the contents of the file, right-click in the file box and select View (F8).
The Report Viewer is opened for any Statistical function that generates a Report file. Click the Form button on the Viewer toolbar to re-open the form, adjust the parameters of the Statistical calculation, and then choose to overwrite or append to the output in the Viewer window.
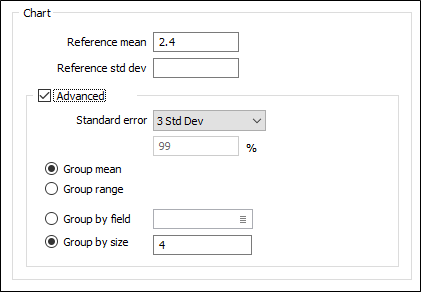
Chart
Reference mean
Enter the Field value of the standard sample. At least 25 groups of observations should be obtained, and the mean of each group calculated. The average of the means is taken as an estimate of the mean, and is used as the reference.
The reference mean is the result you expect the mean of the samples to be. You can determine this using historical data, standards or calculate it using the values in the sample data file.
If you use historical assay data, the means from at least 25 groups of observations should be used. These means should then be averaged. The result can be considered a suitable reference mean.
If you don't make an entry for Reference mean, the program will calculate and use the mean of all the groups. This can only be considered valid if you know that all groups used in the calculation are in control. Any groups that are out of control should be removed before this method is attempted.
Reference std dev
Enter the standard deviation of the Field value of the standard sample. A good estimate of the standard deviation of the value being analysed is required. If left blank the program will calculate and use the mean of all the groups as the reference standard deviation.
See: Reference Standard Deviation.
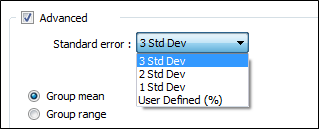
Chart (Advanced)
Select the Advanced check box option to set a warning limit for the Standard error (first, second, or third standard deviation of the sampling distribution) or specify a user-defined action level.
The standard error of the sample is an estimate of how far the sample mean is likely to be from the population mean, whereas the standard deviation of the sample is the degree to which individuals within the sample differ from the sample mean. If the population standard deviation is finite, the standard error of the sample will tend to zero with increasing sample size, because the estimate of the population mean will improve, while the standard deviation of the sample will tend to the population standard deviation as the sample size increases.
If you have chosen to define a User-defined Deciding on an suitable Action Level, enter a percentage (%) value. Values outside this entry should statistically occur in one case in a thousand for a process in control.
Group mean or Group range
Select either Group mean or Group range for the chart type.
GROUP MEAN - the mean of the current assays will be plotted on the Y axis of the chart. It measures how closely the mean of the individual group corresponds to the expected mean (accuracy).
GROUP RANGE - the group range is plotted on the Y axis. This is a measure of the precision or the spread of values in a group. The values of the group could have a small range (high precision) but the mean of the group can still differ markedly from the expected mean (accuracy).
Group by field or Group by size
If you have chosen to group by field, double-clock (or click on the Select icon) to select the Group by field in the Input file.
If you have chosen to group by size, enter the number of check samples sent to a laboratory with each sample batch. This must be constant from submission to submission. If the check sample submission size cannot be predicted it should be set to 1.
The function uses this to calculate a mean for each sample group. It is the mean value that is plotted.
OK
Finally, click OK to run the function using the current parameters. There may be a short delay before the chart appears, depending on the amount of data to process. A progress bar will be shown at the bottom of the screen.
When the function is run multiple times, each chart is displayed in its own tabbed window. This allows a comparison to be made when running the function with different parameters.