Chart
On the Chart tab you can set options to add a title and a subtitle to the chart, apply a theme to the chart, setup marker labels, show a legend, and show properties on the chart.
When a new chart is created, where possible, default titles and labels are automatically generated and displayed on the chart. The (primary) title will default to the name of the chart type, and the secondary title will default to the input file name.
Note that the options shown on the Chart tab may differ from chart to chart.
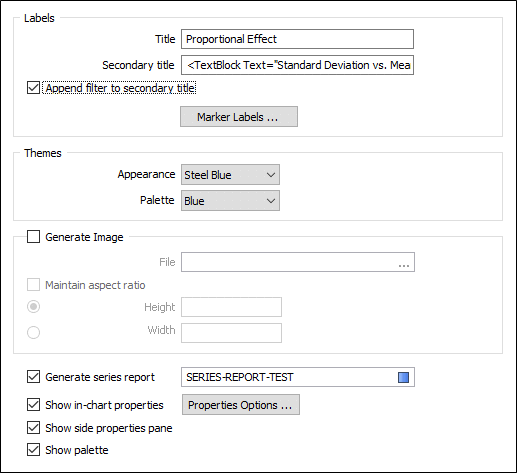
Labels
Title
The text you enter here will appear as a title on the chart.
Secondary Title
The text you enter here will appear as a subtitle on the chart.
You can use XAML markup language to apply formatting to your titles and subtitles. For more information, refer to the: Chart Formatting and Mark-up Reference
Append filter to secondary title
Select this option to append a filter to the secondary title of a chart when a filter has been applied to the input file. (An exception is the Swath Plot, which may have multiple files and filters.)
The filter string is appended to the secondary title in square brackets, for example: AUAVG [HOLE = "GL*"]
Marker Labels
If applicable, click the Marker Labels button to setup labels. See: Marker Labels
Themes
You can quickly set the Appearance (background colour, borders, axis lines) of the chart by applying a theme. A "Default" appearance uses the colours applied to the chart legend to colour the tables in the chart (if any).
The Palette drop down is used to select a colour palette for the theme.
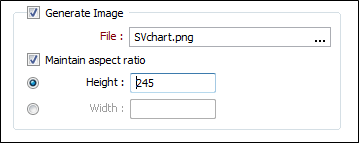
Generate Image
Select this option to generate an image of the Chart display.
File
Double-click (or click on the Select icon) to select the name of the output image file. Rather than specify a file extension, you can click on the ellipsis button and select from a list of supported image file formats.
Maintain aspect ratio
When this option is selected, the Y Scale is recalculated from the X Scale and the current aspect ratio when the Width or the Height of the image (in pixels) is resized.
These options are also available on the Chart toolbar when a chart is opened in Vizex. See: Create Sized Image
Generate series report
If applicable, select this check box to generate a series report for the chart. Specify a name and location for the report file.
Show in-chart properties
If properties are supported for this type of chart, select this check box to set Properties Options and show those properties on the chart.
Show side properties pane
Select this option to show the Properties window alongside the Chart display.
Show palette
Select this option to use the colour range defined in a palette to colour code the chart, rather than select individual colours for each chart element.