Bottom Panel
On the Network tab, below the Viewport, a bottom panel of tabs may be used to interact with the transport network and analyse cycle times.
These tabs are briefly described in the following table. A fuller explanation of each tab is provided below the table.
|
Tab |
Overview |
|---|---|
|
Properties |
The Properties tab is used to display the properties of network components selected. Use Selection buttons to change between the selected data:
The Properties panel view areas and fields change depending on the selected network items. |
|
Error List |
The Error List tab provides a list of errors and warnings. |
|
Road Segments |
The Road Segments tab is used to present detailed information on the selected network segments. |
|
Charts |
The Charts tab can be configured to display elevation, velocity, fuel burn and engine load over time or distance. Use this tab to compare fleet performance and find out where the trucks are slowing down, and why. |
|
Truck Times |
The Truck Times tab presents a stacked bar graph of the cycle time. Use this tab to compare the performance of two or more truck types. |
|
Cycle Time Analysis |
The Cycle Times tab displays the key performance indicators for the active haul. Use this tab to compare fleet sizes, cycle times, fuel burn, TKPH values, productivity rates and delays. |
|
Schedule Auditor |
The Schedule Auditor tab is a planning tool used to visualise material movement across the schedule. If using ATS or APS, schedule information can be imported directly into the Scheduler Auditor. If running HI standalone, one can import an existing schedule that specifies start/end times, period, sources, destinations, loaders, trucks, and materials moved. Haul Infinity will then generate the full cycle time breakdown and 3D haul strings for each schedule record. This can be used to understand material movements across different periods in the schedule to predict where traffic congestion may occur. |
Click on the following links for a fuller explanation of each tab, with examples and practical applications:
Properties
The Properties panel is used to display the properties of network components selected.
By default, the Properties panel is located in the lower right part of a screen.
Select an item for which you want to display properties:
-
Block
-
Node
-
Segment
-
Point

The Properties panel view areas and fields change depending on the selected network items, as shown in the tables below:
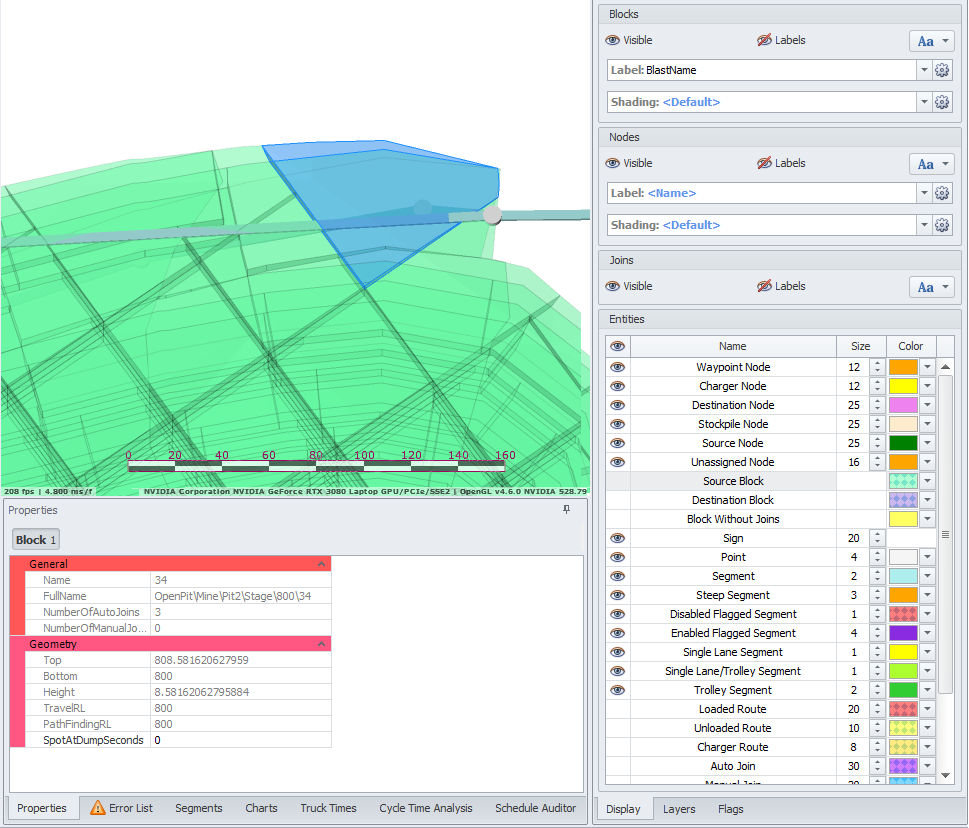
| Block | |
|---|---|
|
|
Review the information for the selected block, such as:
Note that Travel RL and PathFinding RL may differ.
|
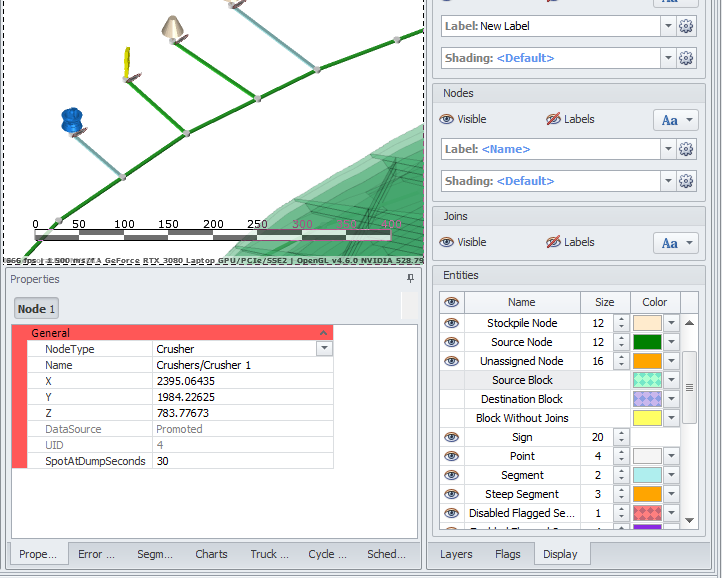
| Node | |
|---|---|
|
|
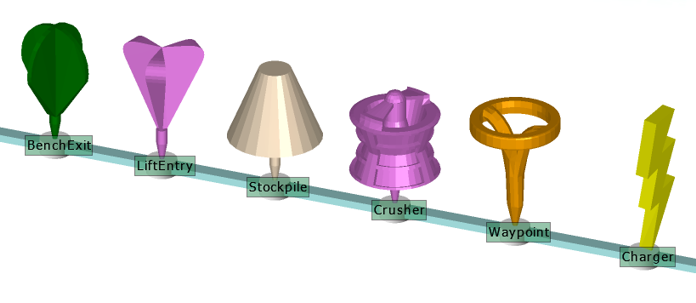
Nodes are fixed load points (or dump points) that we manually connect to the network. Typically, these represent pit centroids, dump centroids, stockpiles and crusher bins.
For a detailed description of each node, see: Define Sources and Destinations |
| Segment | |
|---|---|
|
|
|
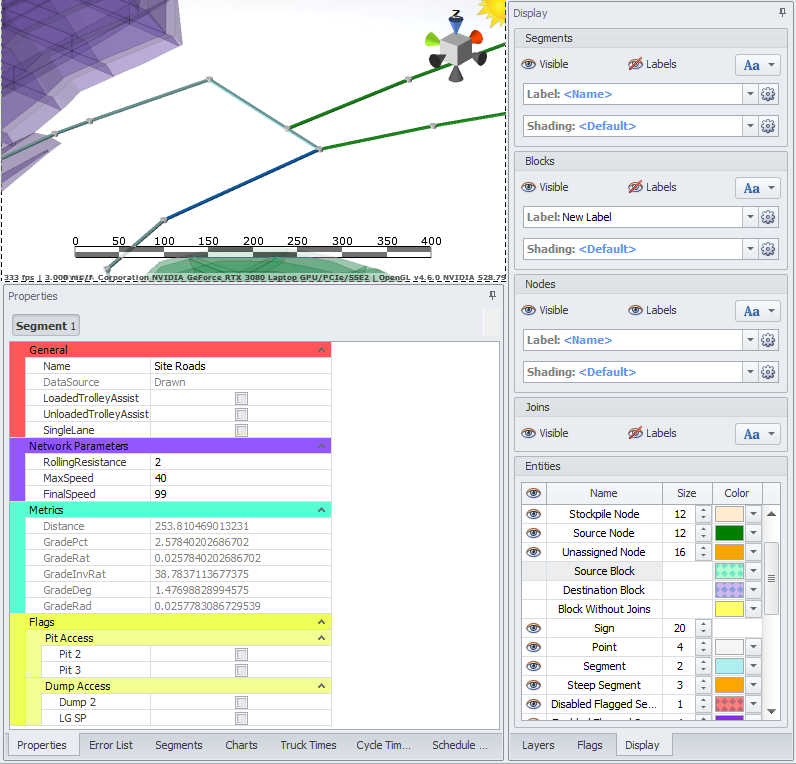
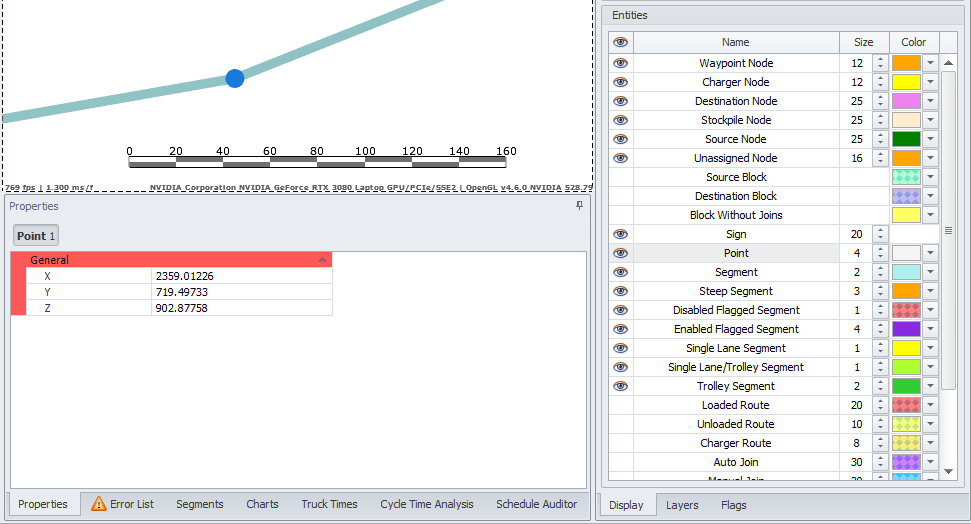
| Point | |
|---|---|
|
|
|
Error List
The Error List tab provides a list of errors and warnings. Review and resolve errors in your transport network.
When making changes to the network, you should always keep the Error List open.
The Error List also provides a warning on the tab to show users potential network issues without them having to open the tab.
-
Double click to zoom to and select erroneous objects.
-
Some errors can be reported twice - like isolated node and unsnapped point.
-
Note that all isolated blocks must be connected to the network, otherwise you won't be able to proceed to the scheduling.
-
-
Use automatic error correction feature (Autofix) with caution, so that you don't get unexpected outcomes.
-
Similarly with the Hide feature - make sure that you do not hide critical errors.
-
Some warnings won't show up in the Error panel: zero tons bucket, zero tons tray, no road connection between source and destination
See Error List Resolution for examples of possible errors and ways to resolve them.

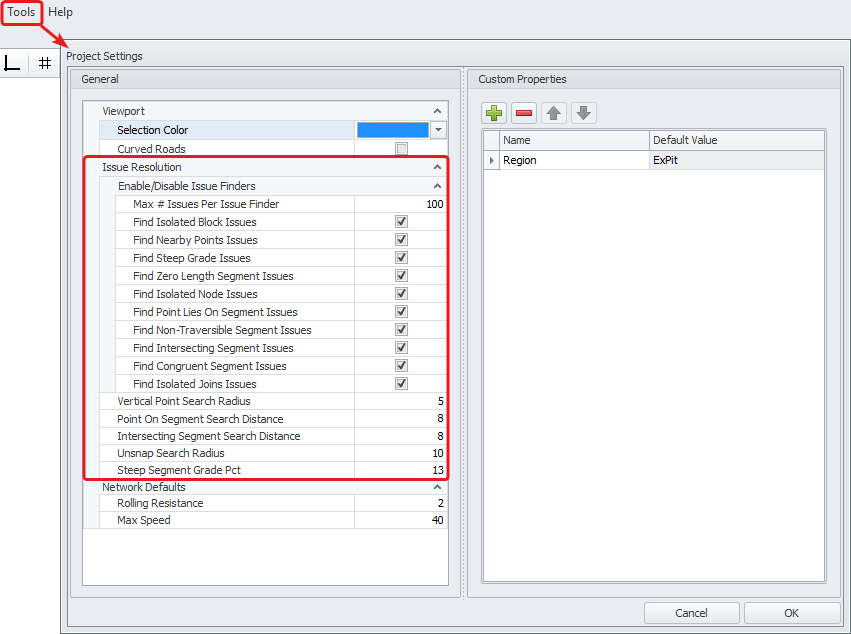
Error thresholds can be changed
To do this, open the Project Settings window (via the dropdown of the Tools button) and flag the boxes for the types of errors that should be displayed in your project and the thresholds for the applicable parameters.
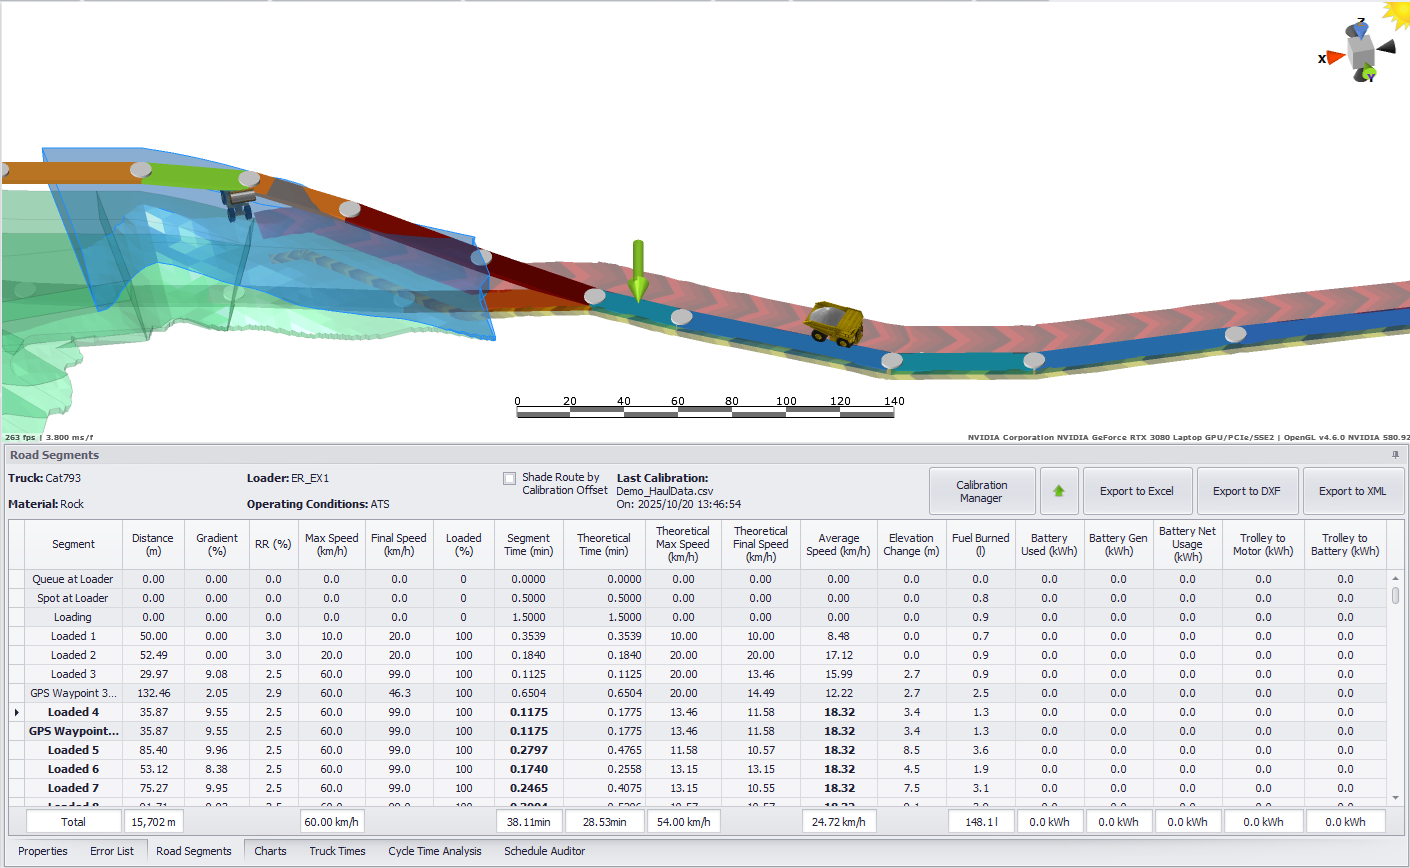
Road Segments
The Road Segments tab is used to present detailed information on the selected network segments.
The data in the Road Segments panel is only displayed when a haul route is selected in the Viewport.
Road Segments tab
-
Select the haul route for which you wish to display the segments data, from the network viewport, from the History panel on the left, or from the Schedule Auditor if a schedule has been imported..
-
The data for each segment of this route will be shown for the Truck, Loader, Material and Operating Conditions selected in the Route Selections panel.
-
Double-click on a segment from the list to zoom to it in the viewport. A large green arrow will point to the selected segment.
-
Alternatively, you can select a segment from the list and press the green arrow button to jump to it in the Viewport.
-
-
Segments data can be reviewed and exported form this tab, but not available for editing.
-
Segments data are split into Loaded and Unloaded.
-
You can review Spotting, Queuing, Loading and Dumping times for each state (loaded and unloaded).
-
If Calibration has been applied to the model, calibrated segments will be bolded.
-
Check the Subtotal to see the sum of each parameter.
Select the network segment(s) from the list or Viewport and check the data, such as:
-
Distance of each segment, in meters,
-
Gradient, in percent,
-
Rolling Resistance, in percent (RR),
Maximum Speed, in km/h,
-
Final Speed, in km/h,
-
Percentage of travelling with a load,
-
Segment travel time, in minutes (This will display the calibrated value, if applied),
-
Theoretical travel time, in minutes (This will always display the calculated time),
-
Theoretical Max Speed, in km/h,
-
Theoretical Final Speed, in km/h,
-
Average Speed, in km/h (This will display the calibrated value, if applied. Calibrated Average speed is based on the distance and actual time between waypoints used for calibrations, so all segments with the same calibration will show the same average speed).
-
Elevation Change, in meters,
-
Fuel Burned, in liters, if applicable,
-
Battery Used, in kWh, if applicable,
-
Battery Regenerated, in kWh, if applicable,
-
Net Battery Usage (Used - Gen), in kWh, if applicable,
-
Trolley to Motor efficiency, in kWh, if applicable,
-
Trolley to Battery efficiency, in kWh, if applicable.
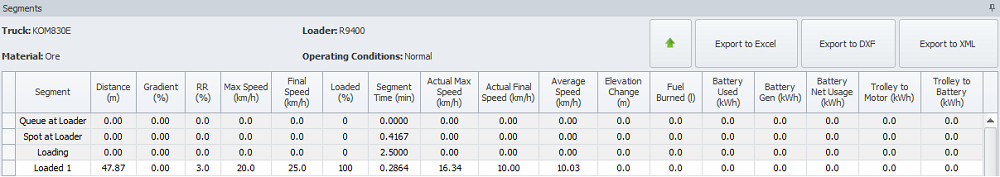
This tab also includes options for exporting segment data to Excel, DXF, and XML files.

Export Options
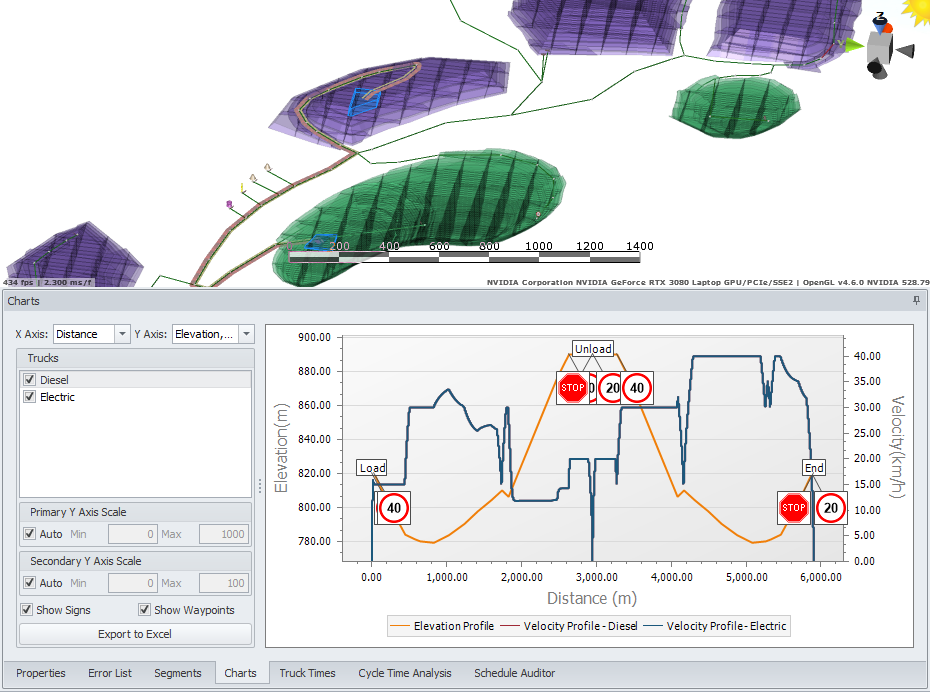
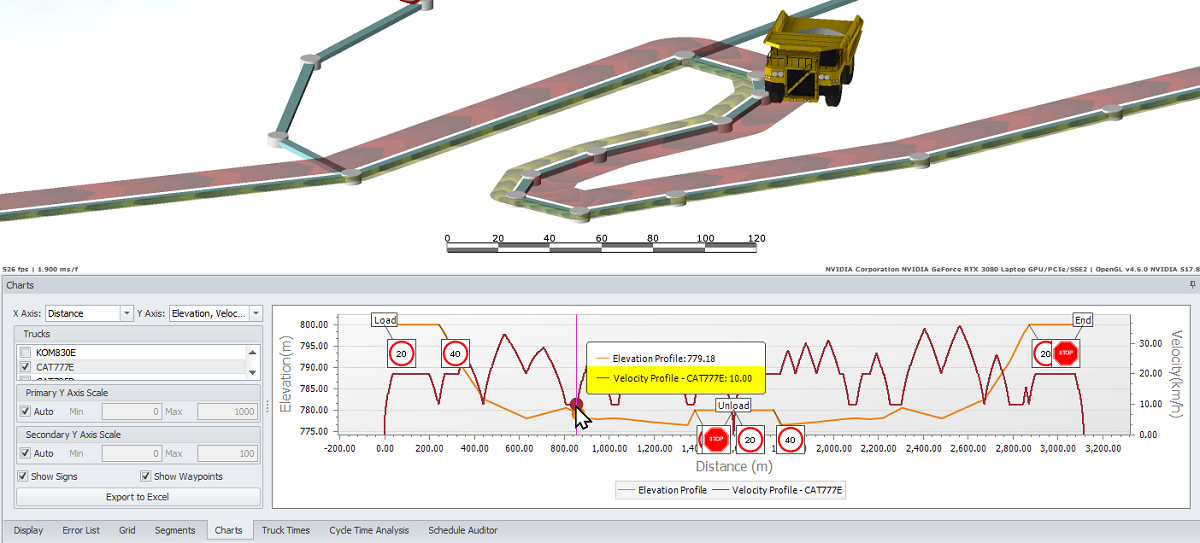
Charts
The Charts tab can be configured to display elevation, velocity, fuel burn and engine load over time or distance. Use this tab to compare fleet performance and find out where the trucks are slowing down, and why.
The data in the Charts panel is only displayed when a haul route is selected in the Viewport.
-
Select the parameters upon which you wish to show the chart:
-
it can be Distance or Time for the X Axis, and
-
Elevation, Velocity, Fuel, Battery and Trolley data for the Y Axis.
-
You can select one or multiple parameters for the Y Axis.
-
-
In the Trucks list flag trucks that charts you wish to display.
-
Specify Primary and Secondary Axis Scales (Auto by default, untick to modify).
-
Overlapping road signs on the chart can be dragged across the charts area or hidden (Show Signs checkbox).
-
Toggle Show Waypoints checkbox to show/hide network waypoints.
-
Hover the mouse cursor over the chart to see position of the truck on the road in the Viewport.
-
You should see how the truck accelerates, slows down when passing the corners, stops for loading/unloading.
-
-
Press Export to Excel to export the chart and the its data breakdown to Excel.

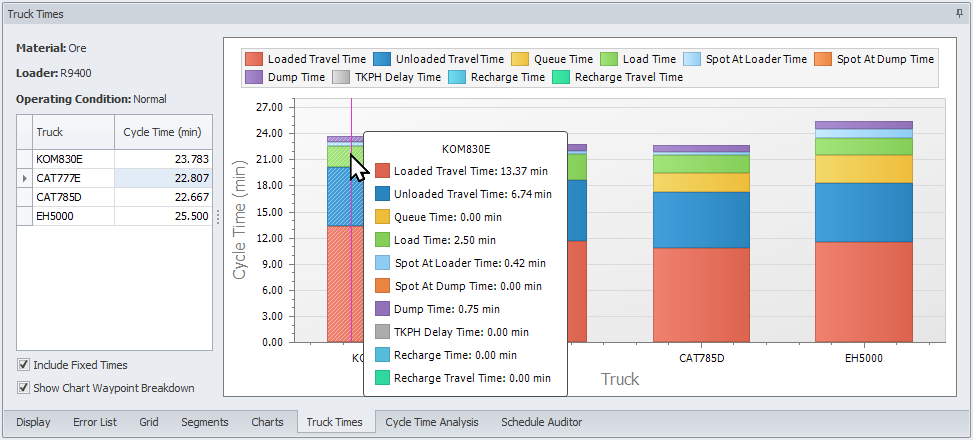
Truck Times
The Truck Times tab presents a stacked bar graph of the cycle time. Use this tab to compare the performance of two or more truck types.
The data in the Truck Times panel is only displayed when a haul route is selected in the Viewport.
-
Select the haul route for which you wish to display truck times from the network viewport or from the History panel on the left.
-
The data for each truck time will be shown for the Material, Loader and Operating Conditions selected in the Route Selections panel.
-
Unflag the Include Fixed Time checkbox if you don’t want to display non-productive truck times on the graph, ie:
-
Queue time, Load Time, Spot at Loader Time, Spot at Dump Time, Dump Time, TKPH Delay Time, Recharge Time, and Recharge Travel Time.
-
-
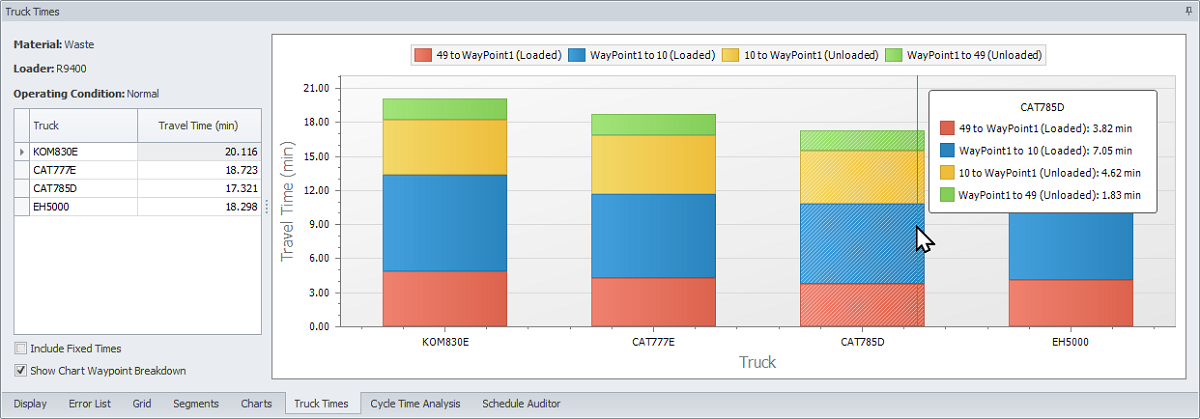
Flag the Show Chart Waypoint Breakdown checkbox to breakdown the graphs by waypoints (if any).
-
each truck’s graph will be split into part To and From the WayPoint, where numbers on the Legend represent Source and Destination blocks numbers.
-
-
Hover the mouse cursor over the required truck graph to display the applicable cycle time values.
Cycle Time Analysis
The Cycle Time Analysis tab displays the key performance indicators for the active haul. Use this tab to compare fleet sizes, cycle times, fuel burn, TKPH values, productivity rates and delays.
The data in the Cycle Time Analysis panel is only displayed when a haul route is selected in the Viewport.
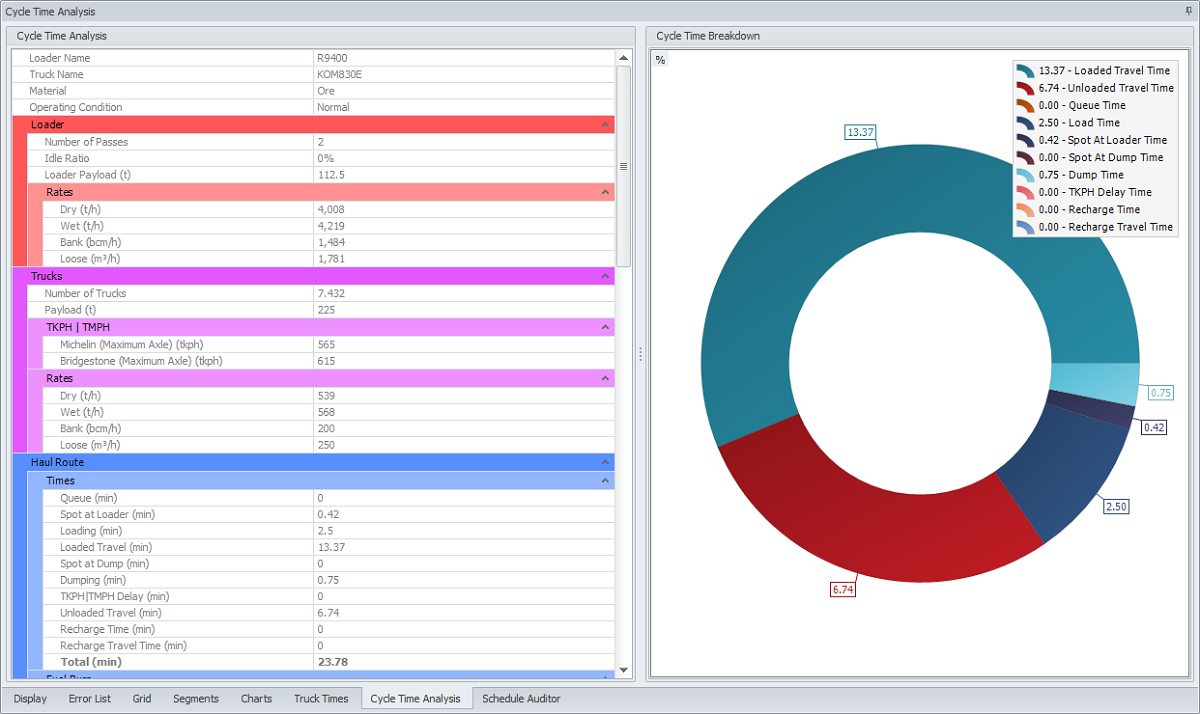
In the Cycle Time Analysis panel on the left see a detailed analysis of time cycles, applicable to the Loader, Truck, Material and Operation Conditions, selected in the Route Selection panel.
The Cycle Time Breakdown panel on the right displays the ring chart of cycle time breakdown into the intervals listed in the legend. Toggle the percent icon in the top left corner to switch units from minutes to percent.
Schedule Auditor
The Schedule Auditor tab is a planning tool used to visualise material movement across the schedule.
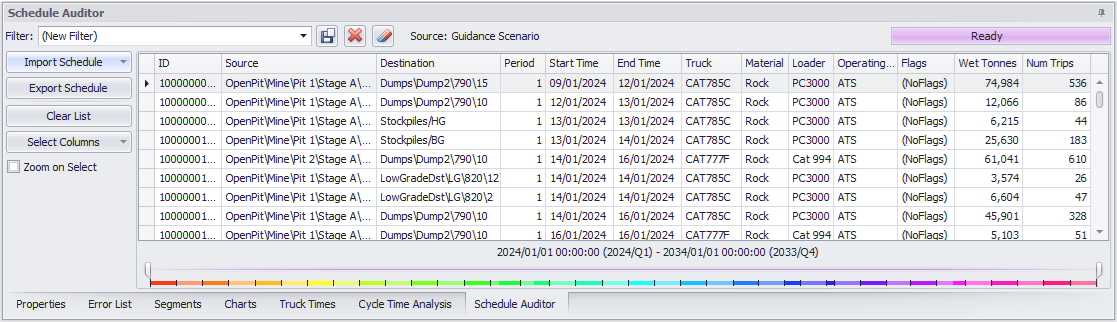
Schedule Auditor tab
Importing a Schedule from the Scheduler
The Schedule Auditor requires a schedule to be imported.
If you are using Haul Infinity within the Scheduler (ATS or APS), you can import a schedule directly.
-
In ATS or APS, make sure the scenario to import has been successfully ran.
-
In Haul Infinity:
-
Under the Scheduler menu or in the Scheduler Auditor tab:
-
Select “Import Schedule from Scheduler”.
-
Select the Scenario to import.
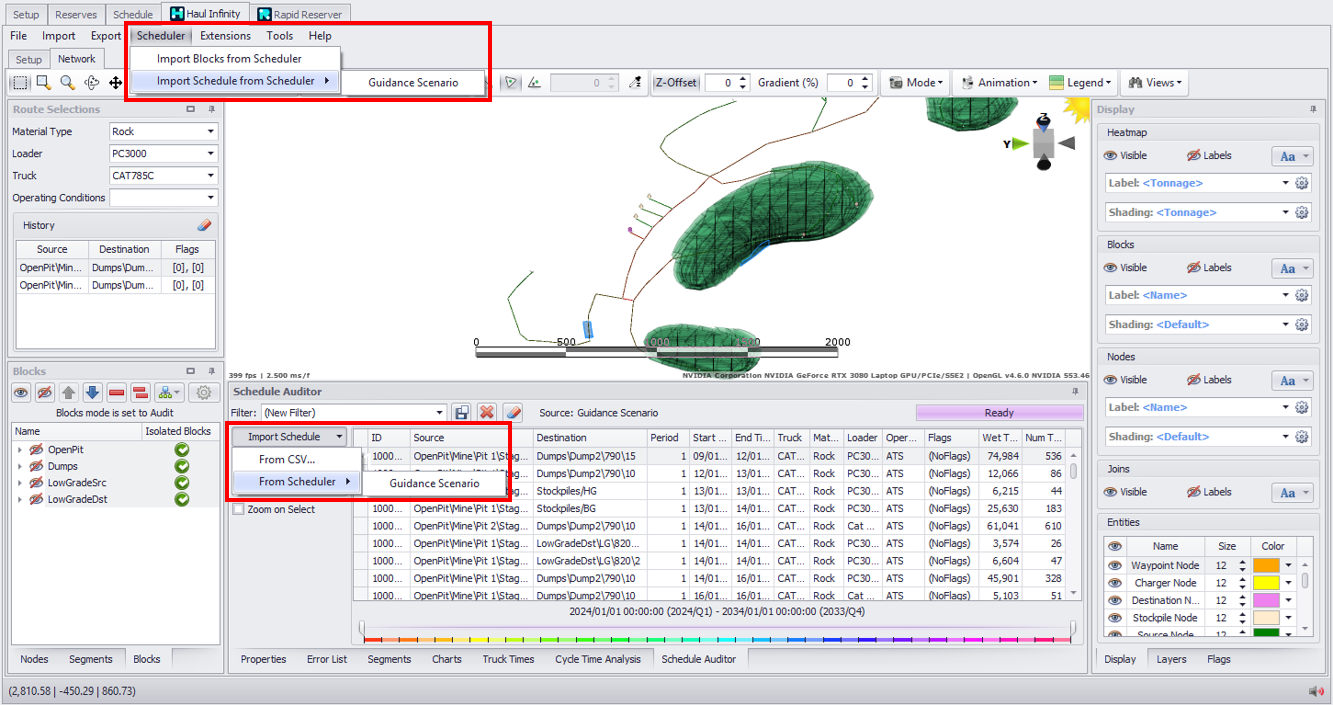
Scheduler > Import Schedule from Scheduler
Importing a Schedule from CSV
To import scheduling transactions from a CSV file:
-
In the Schedule Auditor tab, select Import Schedule from CSV.
-
Select a CSV file which contains the schedule to be imported.
-
Click the blue plus icon to create a new CSV mapping template.
-
Map CSV column headers to the corresponding schedule fields. Bold fields are mandatory.
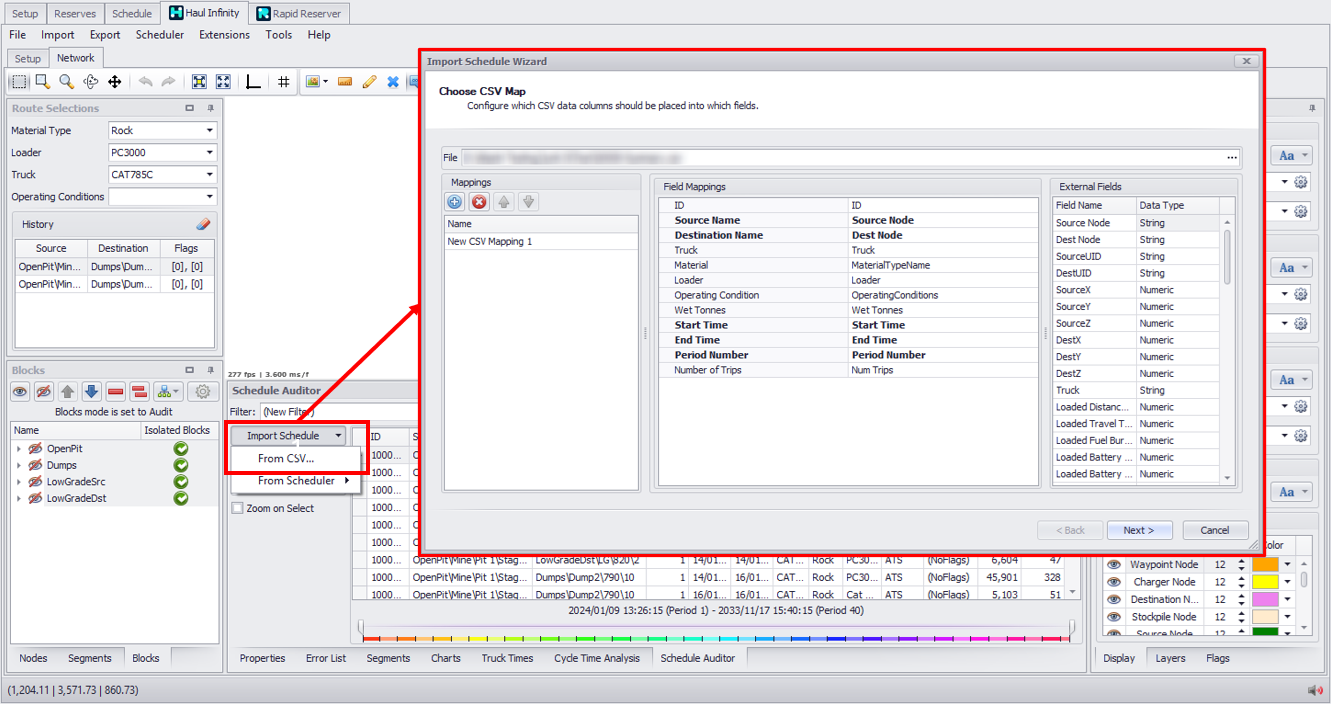
Schedule Auditor > Import Schedule > From CSV
Using the Schedule Auditor
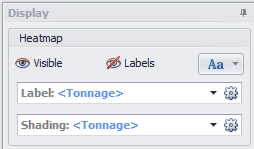
Once a schedule has been loaded, road segments can be shaded by tonnages and number of trips when viewed in Schedule Audit mode.
Use the right display panel to edit shadings and labels, and toggle visibilities. For more information on changing these settings, see: Right Panel
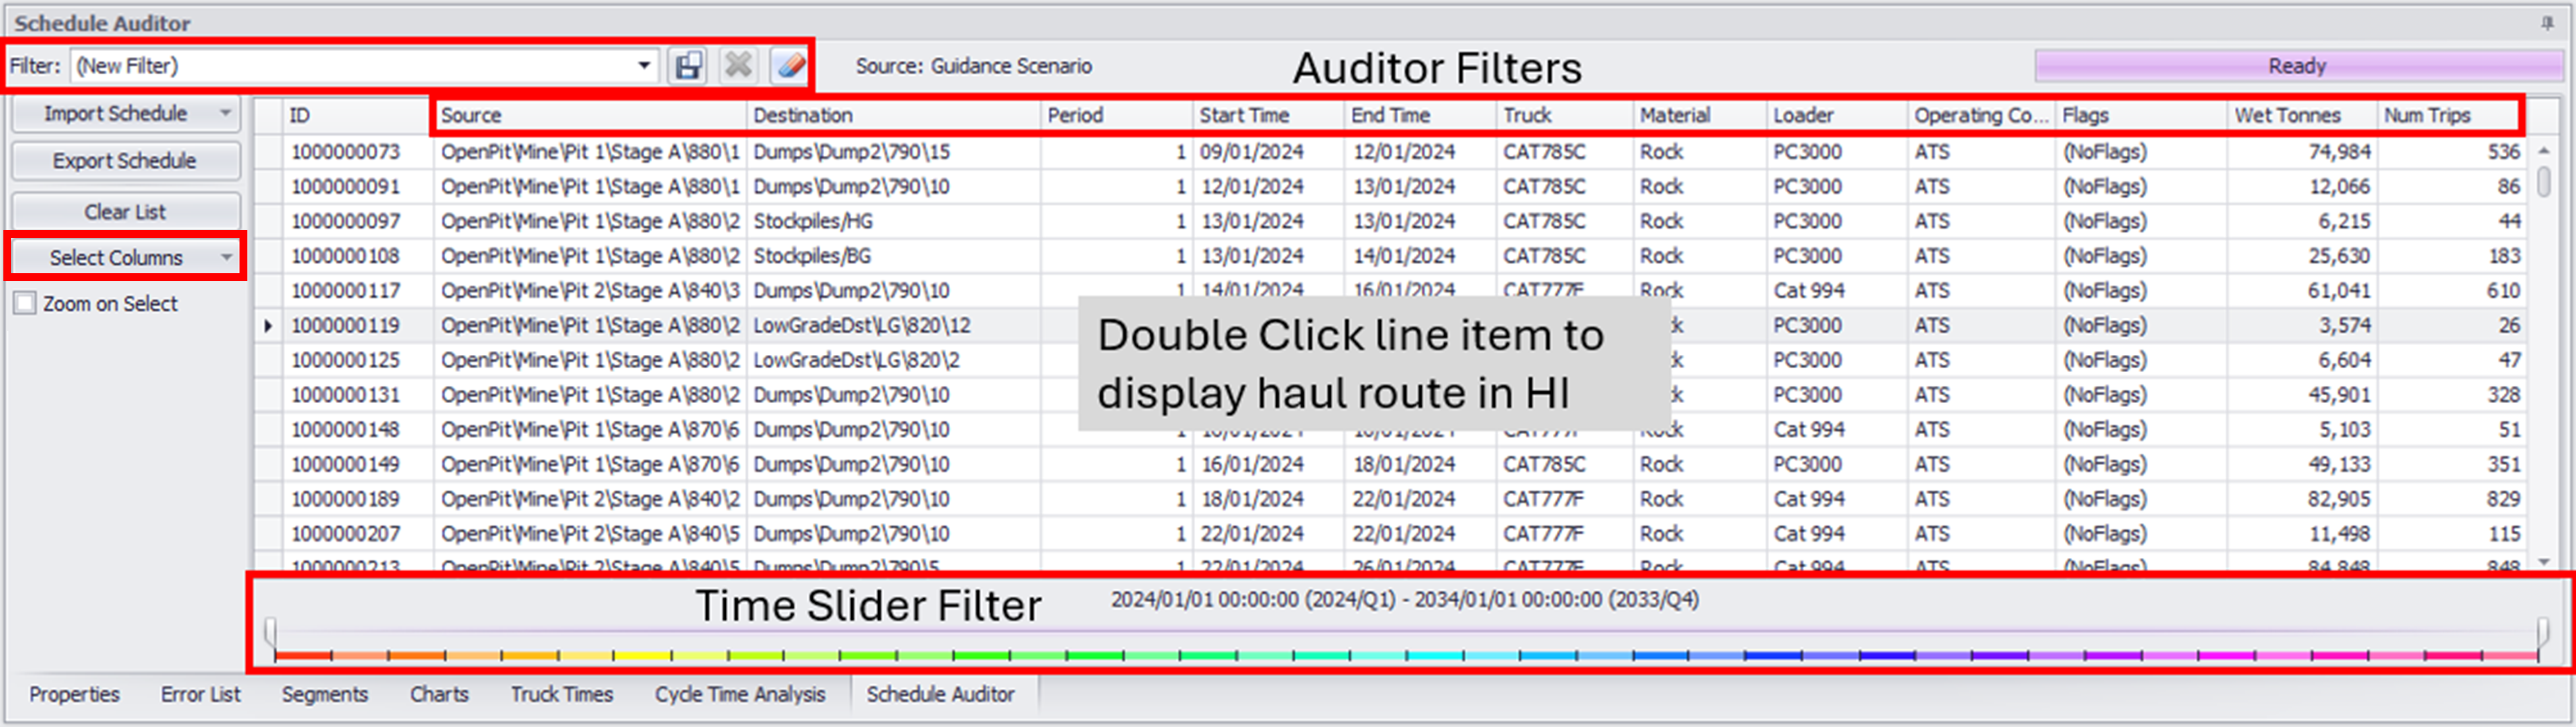
The loaded Schedule can be filtered to allow users to investigate where and when material is moving to better understand schedule and foresee potential issues.
Time periods can be filtered using the time slider at the bottom of the tab.
Columns can be added or removed using Select Columns.
Columns can be filtered by hovering over the column name and clicking on the filter icon that appears.
Once filters have been applied they can be saved using the top left of the UI.
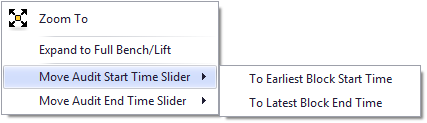
Right-clicking on a block in the viewport allows users to adjust the time slider end points based on when the block was first or last mined:
Exporting a Schedule
Once the schedule has been reviewed, the results can be exported for use in cost modelling and fleet selection.
-
From the Schedule Auditor tab, click the Export Schedule button. Navigate to the folder location you want to save to and name the file.

Scheduler Auditor > Export Schedule
-
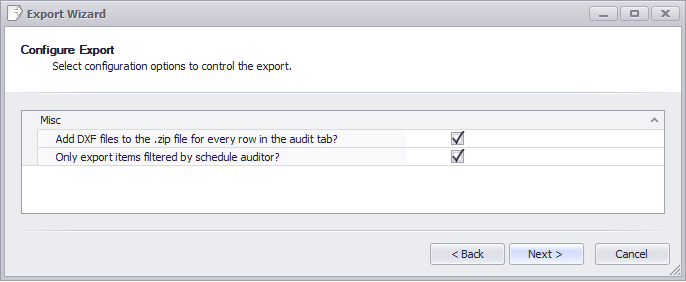
Select from the following configuration options to control the export:
Add DXF files to the .zip file for every row in the audit tab?
Includes a dxf file for the haul path taken for each transaction.
Only export items filtered by schedule auditor?
Uses filters set in the Schedule Auditor to limit the exported data.
-
Once the export is complete, click Finish to exit the Wizard.
-
Unzip the generated archive and review the results.
If the ‘Add DXF Files’ option was selected, you’ll see a “0000-Summary.csv” file listing each Schedule path data and a dxf file for each of the exported transactions.
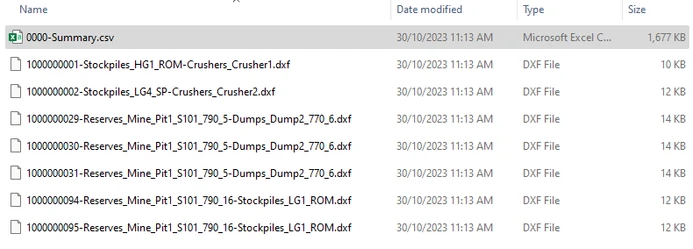
Schedule Audit export results with dxf files for each transaction
Multiple Screens
For easier viewing, panels and tabs can be dragged out of Haul Infinity and onto a second screen.
To support multiple screens:
-
Go to the Network tab.
-
Select and drag the Cycle Time Analysis tab onto a new screen.
-
Select and drag the Charts tab onto a new screen.
-
To dock the tabs, double click on the header bar.