Production Scheduler (APS)
This topic provides a summary of new features and enhancements related to the Alastri Production Scheduler (APS).
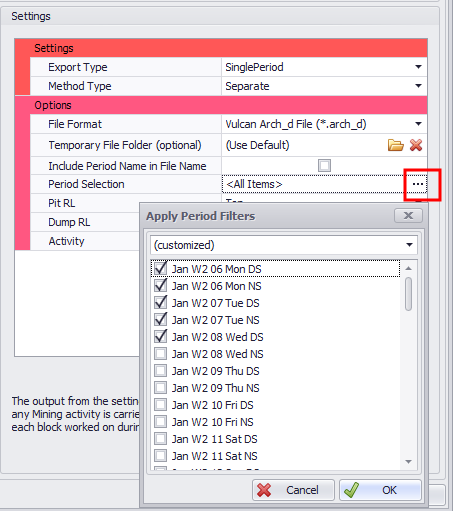
Export Period Polygons
When you select the option to Export Period Polygons on the Animation tab, you can now choose the specific periods you want to export polygons for.
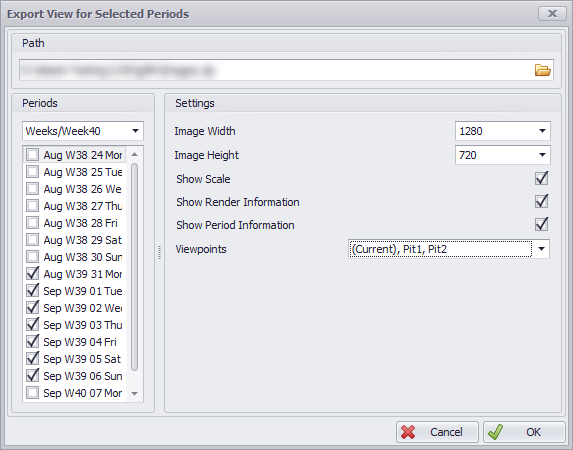
Export Selected Periods
When exporting the view in the Schedule > Animation tab, you can now select an option to export the view for selected periods:
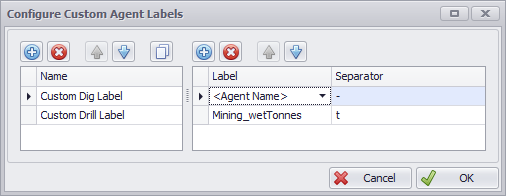
Display Agents
When setting display options for different agents, Agent Labels can be changed using the dropdown menu or customised labels can be created by pressing the Cog icon.
Arrows can be used to show where the agent has been and where it is scheduled to go in the future. The time scale for this can be controlled using the ‘Days Shown’ in the Arrow Display panel.
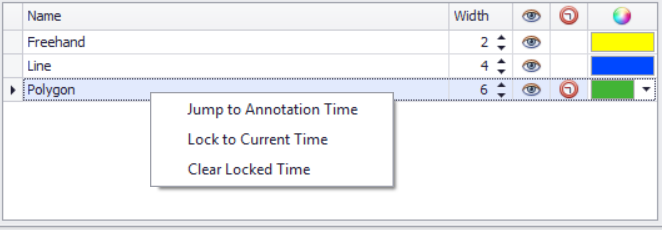
Drawing Panel Tools
In the Drawing Panel, when you right-click on an annotation in the list, in addition to using the Lock to Current Time option to have an annotation appear in the animation based on the current slider location, you can also clear the time lock or jump to the animation time (if the annotation is time locked).
Crusher Downtimes
On the Schedule > Calendar tab, crusher downtimes are now reported along with the reasons for each downtime.
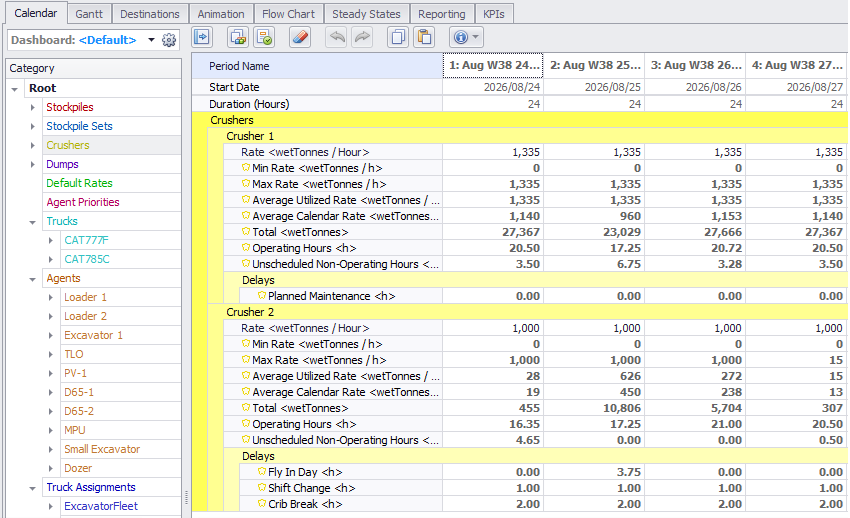
Calendar crusher rates and downtimes
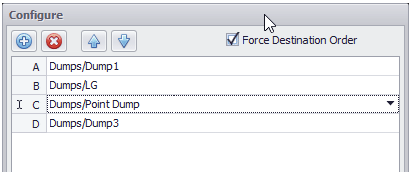
When setting Destination Rules using only dumps, you can now use a Force Destination Order option to prioritise order over tonnes.
Production Mode Features
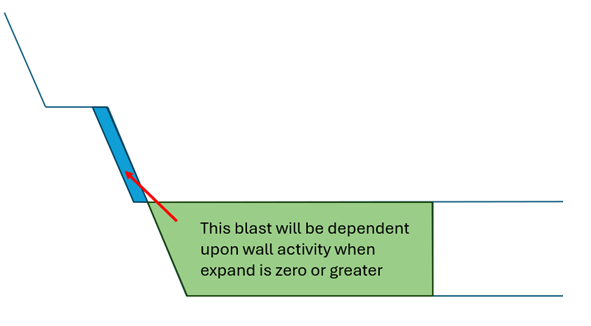
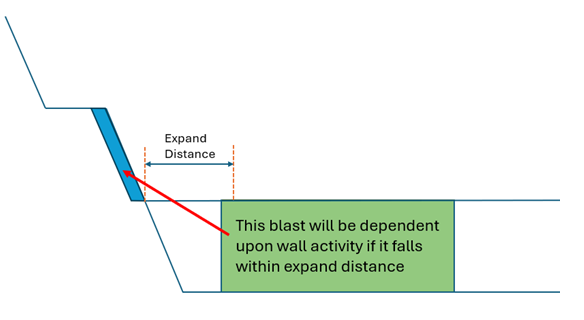
In the Production Mode Features step, when you select which wall panel activities to include in the project, you can now set expand distances for Wall Solid dependencies:
With specified wall control, the Blast Shapes Generator will create trim shots based on Wall Control Designs. Note: Only the default ‘Wall’ control design is used for creating trim shots.
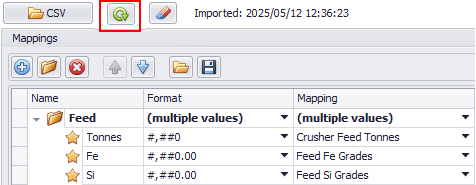
Non-Spatial Guidance
You can now click a Refresh button to update the data in the Non-Spatial Guidance step without having to open the user interface and navigate to the Import file. This will only work if the file name and the file location have not changed. The Import will use the same mapping as last used with that file.
Reporting Dashboards
On the Reporting tab, Dashboards can now be used to combine frequently used charts and tables into a single view that can be saved and easily reopened:
For more information, see: Reporting Dashboard
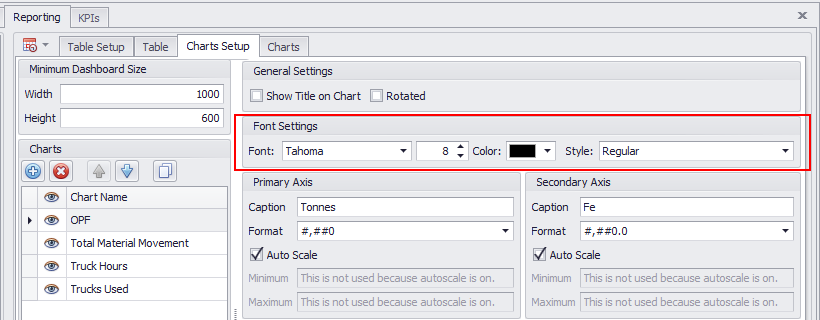
Chrono Reports
On the Schedule > Reporting tab, when you configure the data tables and charts of a Chrono Report, you can now set the Font Settings to be used for legends and labels. These are unique for each chart.
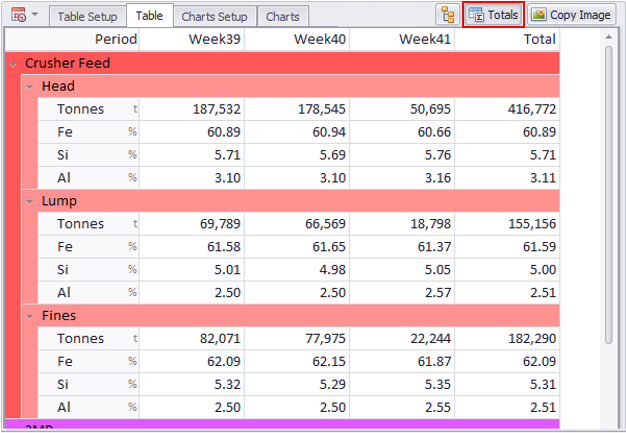
When you setup a Chrono Report and click on the Table tab to view the final report, you can now collapse/expand the sections in the table using the grey down arrow next to the header name:
Alternatively, use the Collapse/Expand button on the toolbar to collapse/expand all sections.

You can also click a Totals button to add a total column to the right-hand side of the table:
Custom Reports
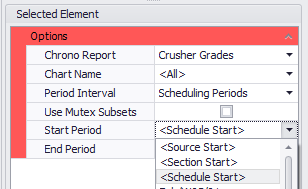
In the Custom Report workspace, in the Section Options pane, the Override Source check box option (which sets report elements to use the Start and End periods from the section, rather than what was setup in the source element) has been replaced by a drop-down to select the Start and End periods in the Selected Element pane.
Each element can have its own start/end dates, or they can reference the dates from the Section, Source or Schedule:
-
Section Dates refer to the dates selected in Section Options
-
Source Dates refer to the dates configured in the Source Report
-
Schedule Dates refer to dates defined by the Schedule
Mutex Subsets
The Section Options pane now allows different Mutex Subsets to be specified for each section (rather than different Start and End periods). This can be useful when creating the same report each planning cycle; one only needs to update the Mutex Subset rather than the Start and End date on all elements.
The same Mutex Subsets may also be selected for individual elements, such as Chrono Charts and Chrono Tables, Gantt Reports and Gantt Charts
The Period Plot report allows you to select which activity to display, while the Viewport report now allows you to only show agents for a selected activity.
Pivot Report/Pivot Tables
When adding Pivot Report or Pivot Table custom elements, a Use Mutex Subsets check box option can now be selected to reference Period Mutex Subsets and associated groups.
A drop-down to select the Start and End Periods (when the Use Mutex Subsets check box is NOT selected) is also available.