Viewing Drillholes
Drillhole Objects are represented as a single object but are actually linked to multiple files - such as .dhdb, .DAT and other file types.
Drillhole data is received in MMO&B via a data file such as a .csv where the relevant Geologist user imports incoming data to .DAT tables, validates them and creates a Drillhole.DHDB inside the local MMO&B project. The resultant Drillhole.DHDB + Collar.DAT + Interval.DAT + Survey.DAT and Event.DAT files are uploaded to Nexus to share the Drillhole data with the Team.
Another Geologist user can download the Drillhole data to their local MMO&B project to get the files and use them for Ore body interpretation. This process creates a new version of the Drillhole data to be uploaded to Nexus along with the resulting wireframe from the Ore Body interpretation. This is the file that can be viewed in Nexus.
Drillhole data created in Vizex within Micromine Origin & Beyond can be uploaded to the linked Nexus project using the Upload Files option in the right-click menu.
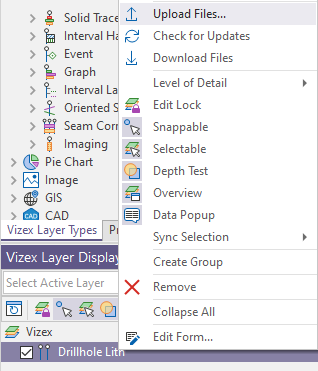
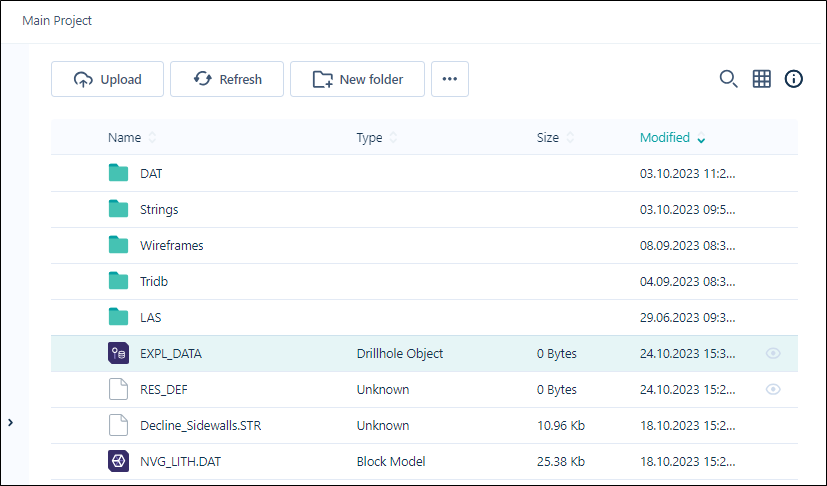
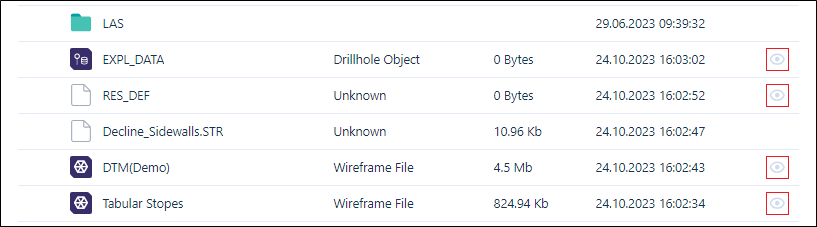
The uploaded drillholes will appear as a single object to be opened in the Viewer.
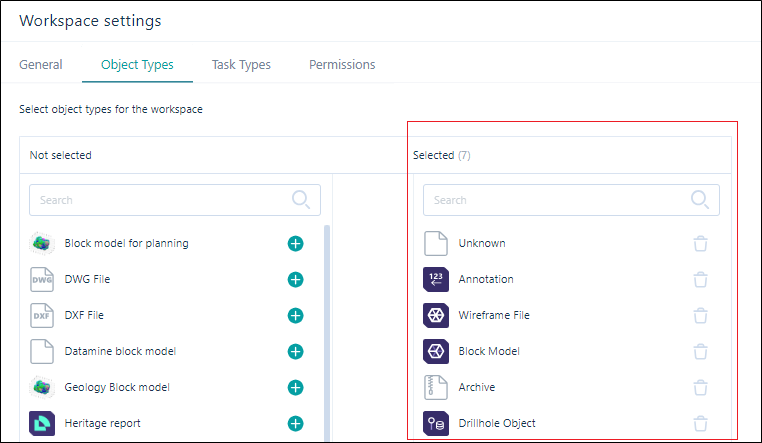
Note: For drillhole data to be displayed as a Drillhole Object when uploaded to Nexus, the Drillhole Object type must be Selected in the Object Types for your Workspace Settings.
Nexus drillhole objects can also be created in Nexus with the required data files in CSV format using the Upload Drillhole Data tool.
To view a Drillhole object,
-
Select Viewer from the Navigation menu.
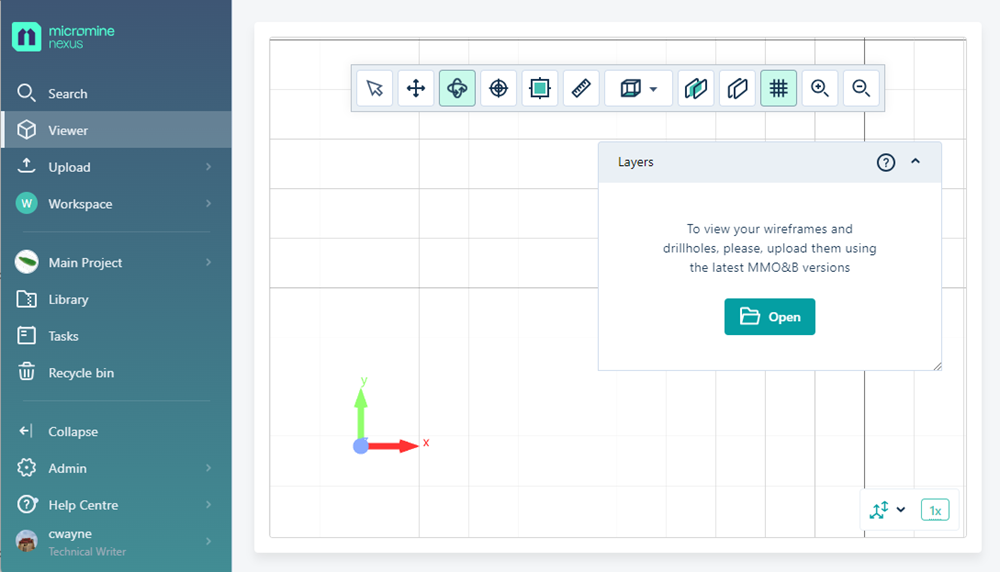
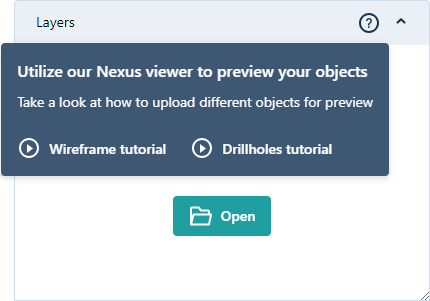
The Open button in the Layers panel is used to select the object to be displayed in the Viewer.
For a brief video on viewing and interacting with drillholes you upload from MMO&B , select the Help icon in the right corner of the Layers panel and select Drillholes tutorial.
The tutorial opens in a focussed window:
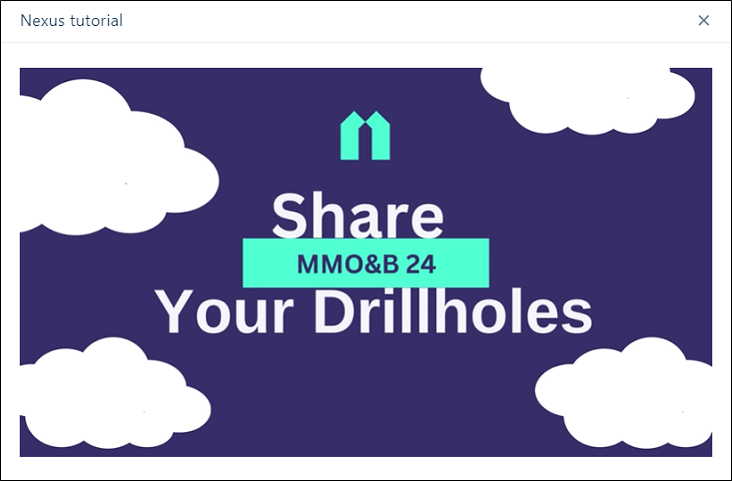
Click the image above to view the video in your browser
Nexus objects that can be opened
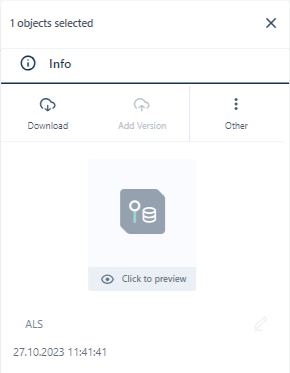
Viewable objects can be opened from the Project or Library directly, from the Click to preview link in the Info panel, or from the Select Object form from the Layers Panel:
-
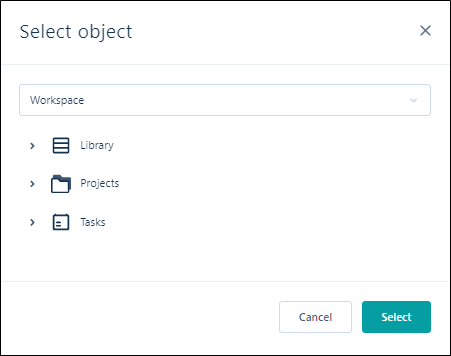
Click Open to display the Select Object form.
-
Use the drop down to select the relevant Workspace and navigate to the object to be visualised using the Library, Projects and Tasks lists.
Note: Any object that cannot be viewed will not appear in these lists.
-
Click OK.
The Viewer will display an animation while rendering of the object is in progress.
When you open a valid drillhole, it will be rendered in 3D in the Viewer grid. It can be examined and manipulated using the tools provided in the toolbar. See Viewer Tools.
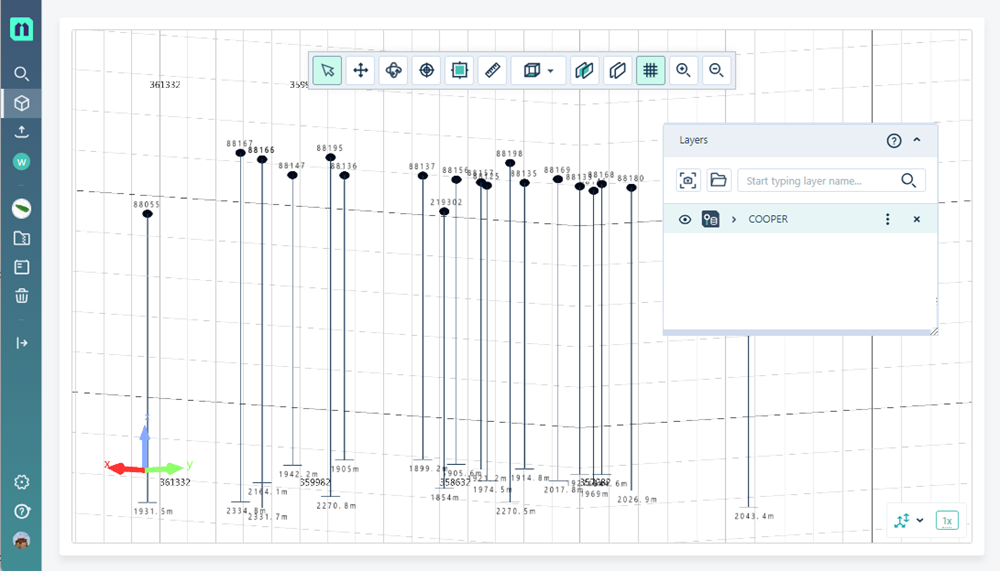
The drillholes are displayed in the Viewer according to their coordinates. Each drillhole has coordinates configured and will be located in the viewer according to position. If more than one drillhole with different coordinates is uploaded to the viewer simultaneously, the difference in position will be demonstrated in the display.
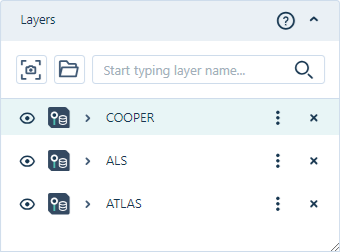
The drillhole databases you have opened are displayed in the Layers panel.
For each database in the panel, you can expand the entry to access the Colour Set entry. If there are errors in the database, such as data that is missing coordinates, a warning icon and a message will be displayed:
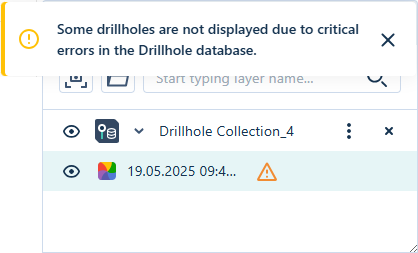
Note: Valid drillhole data will be displayed if you proceed, while data with errors will be ignored.
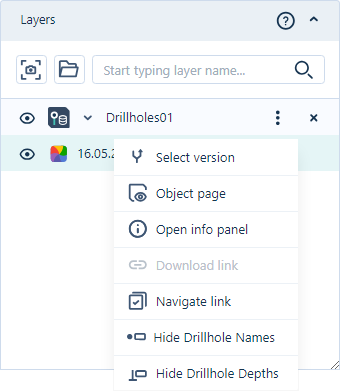
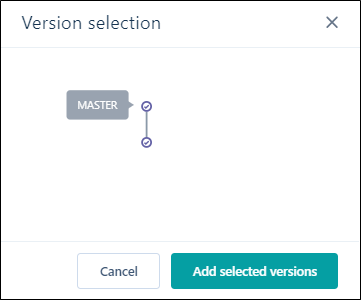
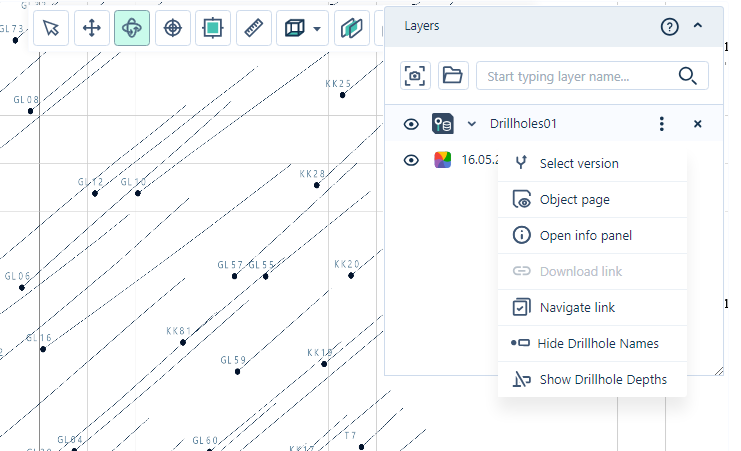
From the More menu in the Layers panel, you can use the Select version option to select a specific version of the drillhole file.
The option will open the Version selection panel from which you can select and open the required version.
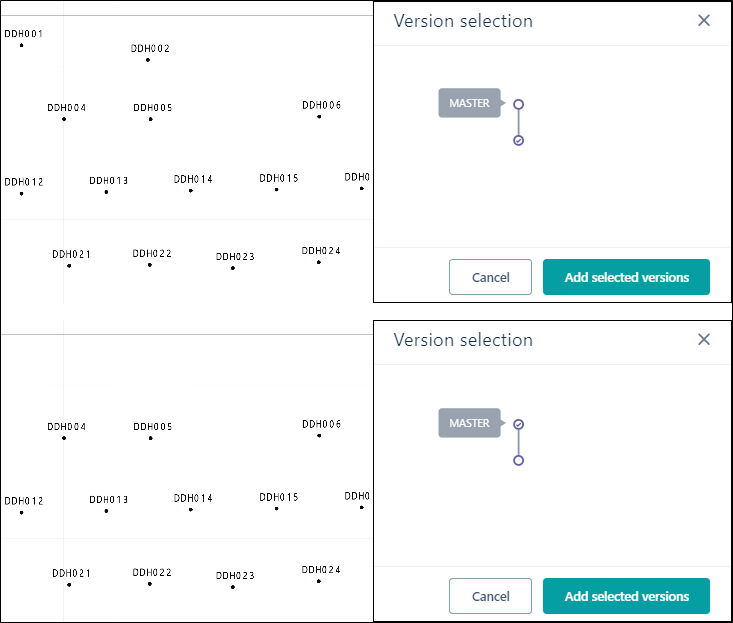
Selecting a particular version or displaying multiple versions will determine the information that is displayed in the Viewer. For example, for the following drillhole database file, holes DDH001 and DDH002 have been deleted from the Master, but selecting only the previous version will still display them:
The Object Page option in the Layers panel More menu opens the Object page for the displayed drillhole object.
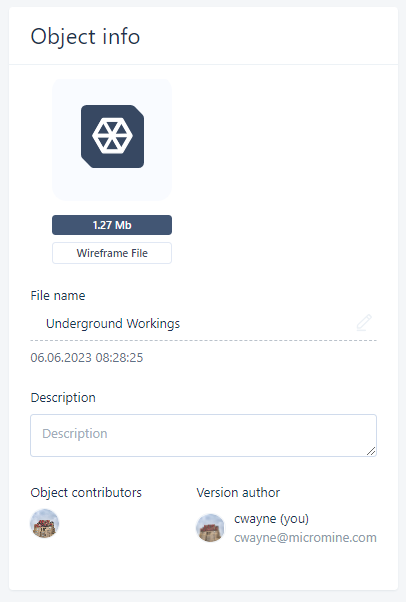
The Open info panel option in the Layers panel More menu opens the Info panel for the drillhole object.
The Download link option will create a link that can be shared with external users to download the file/object for the object page, where available.
The Navigate link option will copy a link to the displayed drillhole object. The created link will navigate to the object opened in the Viewer.
If you select the Hide Drillhole Names option, drillhole labels will be removed from display in the Viewer. The option will toggle to Show Drillhole Names which can be used to return the labels to display.
If you select the Hide Drillhole Depths option, drillhole depth labels will be removed from display in the Viewer. The option will toggle to Show Drillhole Depths which can be used to return the depth labels to display.
You can select individual drillholes to display the Collar properties panel:
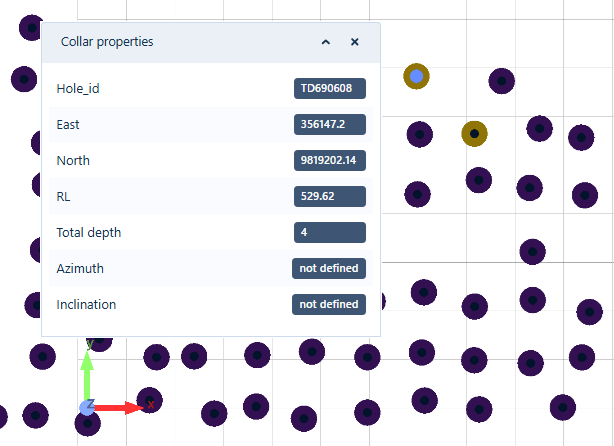
The Collar properties panel displays any existing collar information for the Drillhole, such as:
-
Hole ID
-
Easting, Northing, RL
- Total depth
-
Azimuth
-
Inclination
The Attributes tab of the Info panel displays the Object Attributes for the drillhole object as well as any user-defined Attributes for the drillhole.
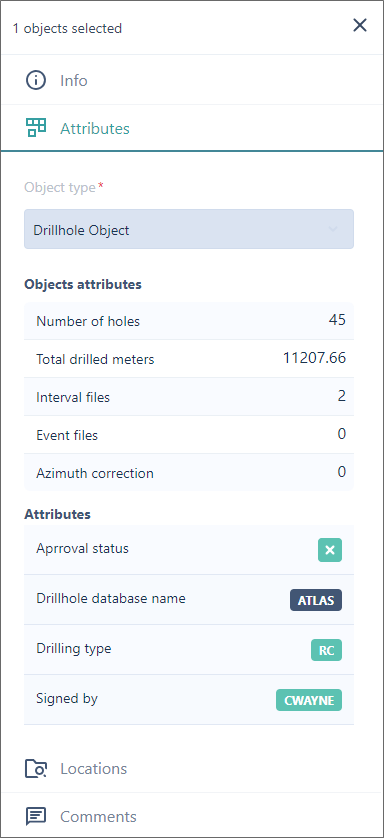
The information displayed in the Attributes tab for the object includes:
-
Number of holes
-
Total drilled meters
-
Interval files
-
Event files
-
Azimuth correction
You can Close the Info panel using the cross in the top right corner.
Interval information can be viewed from the Interval properties panel by selecting an interval for the drillhole object in the Viewer:
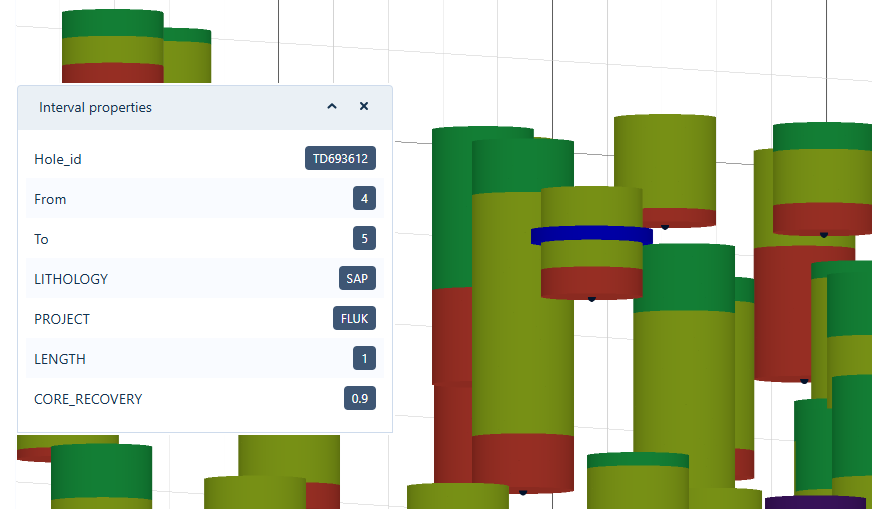
When selected, the interval in the Viewer will be displayed with a solid blue selection indicator and the Interval properties displayed - as illustrated above.
The Solid Trace option with any radius can be enabled for more convenient selection. You can also hide any unnecessary intervals for improved clarity. By clicking on an individual solid along the trace, the corresponding interval table data will be shown in the Interval properties panel; including all values from every field related to that interval.
Information displayed in the Interval properties panel includes:
-
From and To depths
-
Sample code
-
Grade values
-
Easting, Northing, RL coordinates
-
Other information contained in the Interval
For more detail, you can switch to Section View, zoom in, or use Solid View. Selecting any interval will display its complete record information along with the associated value.
You can Close the Interval properties panel using the cross at the top right.
If you drop down the Drillhole object entry in the Layers panel and hover on the Colour Set entry, the Find Drillholes option is enabled:
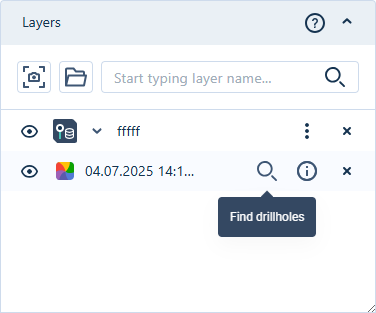
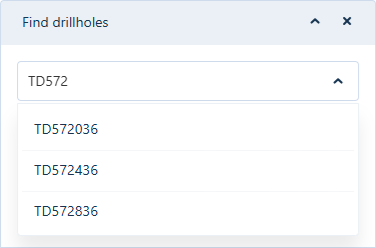
Click the Find icon to open the Find Drillholes panel:
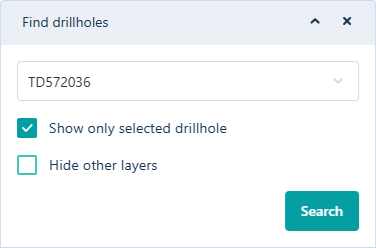
The drillhole can be selected from the drop down provided:
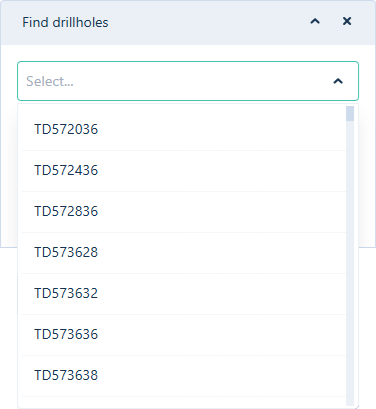
Alternatively, you can enter search text in the Select field and filter the list of drillholes:
When a drillhole is selected, it will be displayed in the Viewer, centered in a top-down view. The drillhole will be selected, and the collar properties panel is displayed.
Selecting the Show Only Selected Drillhole option in the Find drillholes panel and then clicking Search will filter the Viewer to display only the selected drillhole.
Similarly, the Hide Other Layers option will hide any open layers besides the one being searched. If the search layer is not visible, it will be toggled ON. The Find Drillhole tool will be closed and then opened on the layer being searched. The Show Only Selected Drillhole option will be disabled.
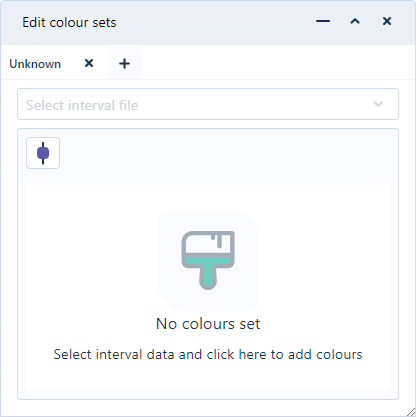
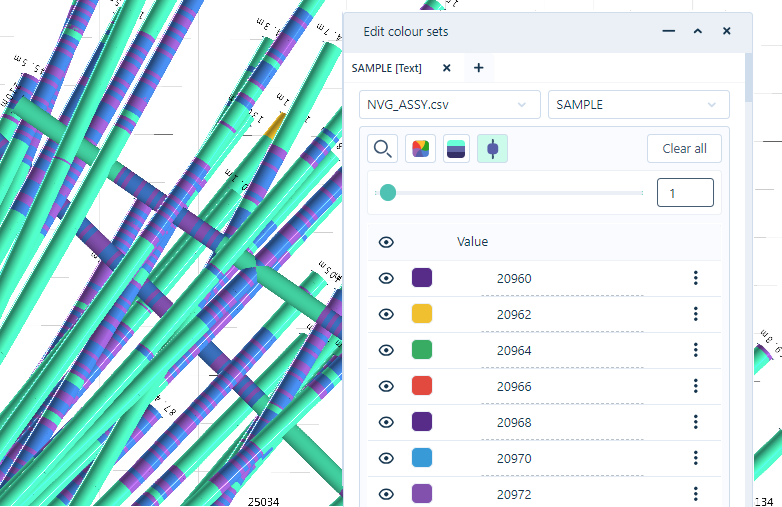
If no colour set has been defined for the Intervals in the displayed drillholes, clicking the Colour button in the Layers panel for the drillhole layer will open the Edit colour sets panel with a prompt to assign random colours to each interval.
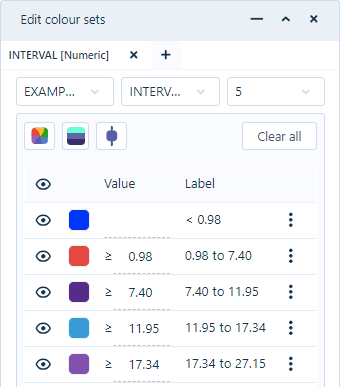
If you select an Interval file from the drop down, the Colour Field drop down is enabled. Select a colour field from the available fields to assign a random colour to each value in the selected colour field for a Text colour set, or enable the Number drop down to select the number of percentiles to display for Numeric colour sets.

With a Text interval colour set open, you can use the Search icon to find a specific entry using a keyword:
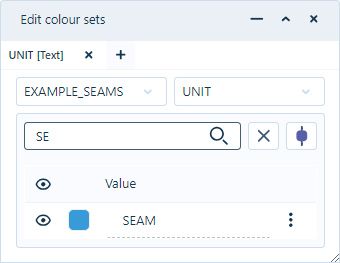
Text you enter in the Search field will filter the interval list to help you find the required entry.
The Ramp Colours button will change the assigned colour for each entry to perform colour ramping.
Colour ramping automatically generates graduated colours between the start and end colours of the Numeric or Text intervals colour set. You can automatically set the colour ramp for the intervals using the Ramp Colours button. This will assign the graduated colours for each code in the drillhole data, using the colour for the first code and the colour for the last code for reference:
For more information on editing colour sets, see Colour Sets.
The Solid View  button provides solid trace visualisation of the drillholes in the Viewer.
Solid traces show colour-coded downhole data or specific numerical ranges and character codes. Drillholes are displayed in a 3D view in the same manner as the Solid trace Vizex layer in Micromine Origin & Beyond with the default parameters.
When toggled ON, the Solid Trace button activates the Solid Trace Radius slider. Using the slider, or entering a value in the field provided, you can determine the displayed radius of the solid trace to a maximum value of 50:

You can toggle Solid View OFF by clicking the button again.
The Show Labels button toggles the display of grade or lithology codes labels along your drillhole traces for the displayed data. When the button is selected, any drillhole labels in the interval file will be displayed in the viewer for each interval:
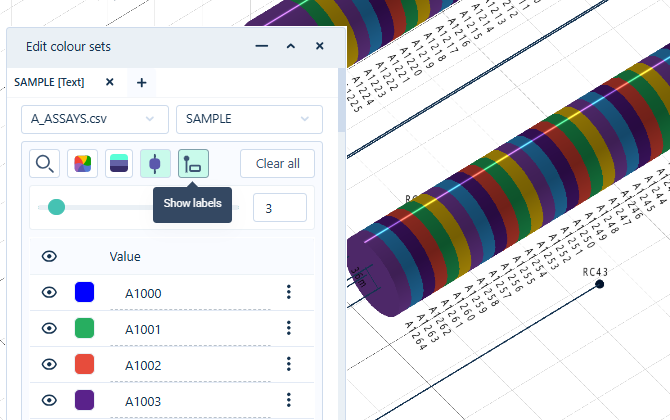
Note: this option is only available when Vertical Exaggeration is set to 1.
The Clear All button will clear the colour set and the displayed drillholes of any assigned colours, colour ramping, and any solid view settings. The selected Interval and Colour field will not be cleared, and the Labels will remain in place if they are ON.
![]()
You can restore the previous colour set configuration by reselecting the same Colour field, or selecting another Colour field of the same type (Text or Numeric).
If required, you can use the Vertical Exaggeration control at the bottom right of the Viewer to change the Z scale for the visualisation.
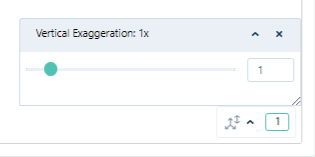
Adjusting the vertical exaggeration is useful when visualising large areas with short traces and a very small Z range such as alluvial ore bodies and stratiform deposits such as coal. Without an adjustment to the Z dimension, it is sometimes difficult to recognise that there are two polygons very close together.