Statistics
This
Ternary Diagram Display
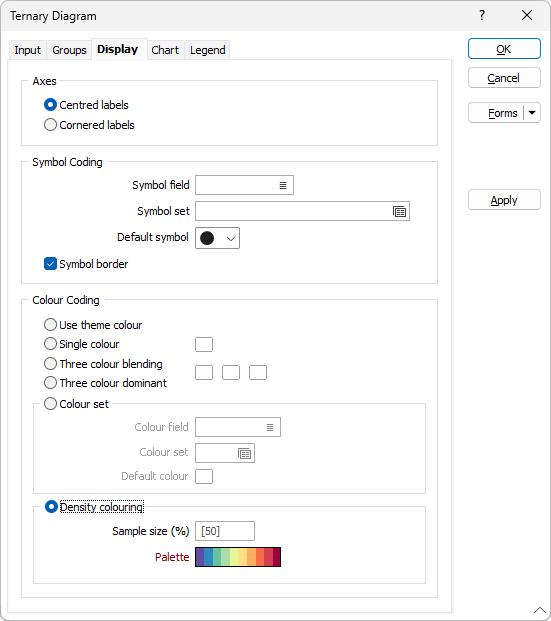
The Show grid lines above data points option has been added to the Display tab in the Ternary Diagram tool on the Stats tab, in the Charts group:

With the option selected, gridlines in the generated Ternary Diagram will be displayed above the data, so that they are always visible.
For more information, see Ternary Diagram.