Chart | Dendrogram
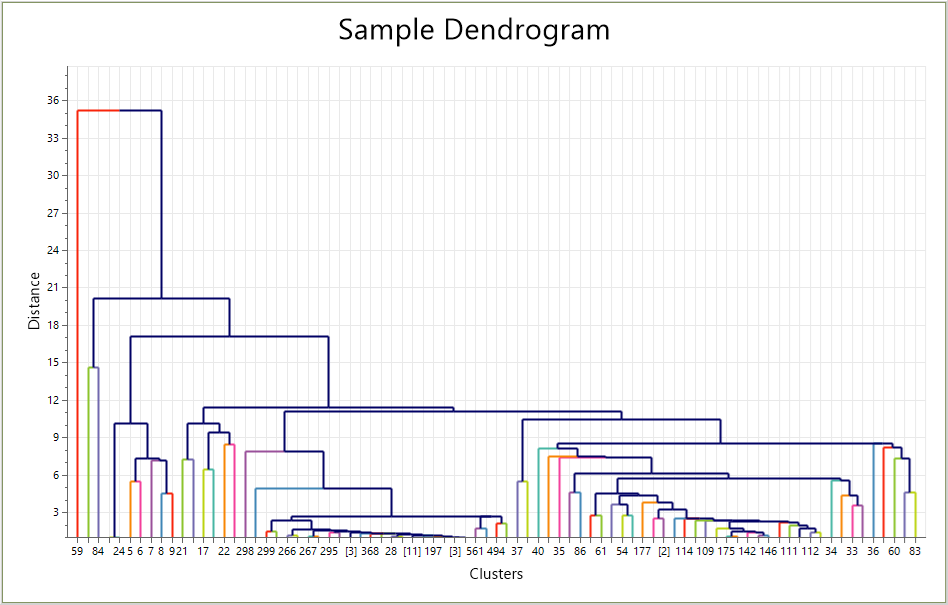
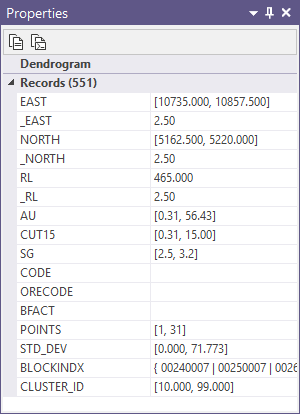
The Chart | Dendrogram window comprises two parts: the Graph and the Properties Pane. The Graph displays the hierarchical clustering data in a tree visualising the distance between samples.
Sample data points are allocated to clusters based on either the selected Calculate Hierarchy algorithm, or the specified Read Hierarchy to File file.
The height of the horizontal connecting line between two data points represents the similarity of the points. That is, the lower the Distance value, measured in the Y axis, the less difference between the Clusters, measured on the X axis.
The Clusters X axis displays either the record number of the sample, if that branch only contains one cluster, or the [sample count] in brackets.
You can select a cluster branch in the graph and view the details in the Properties pane.
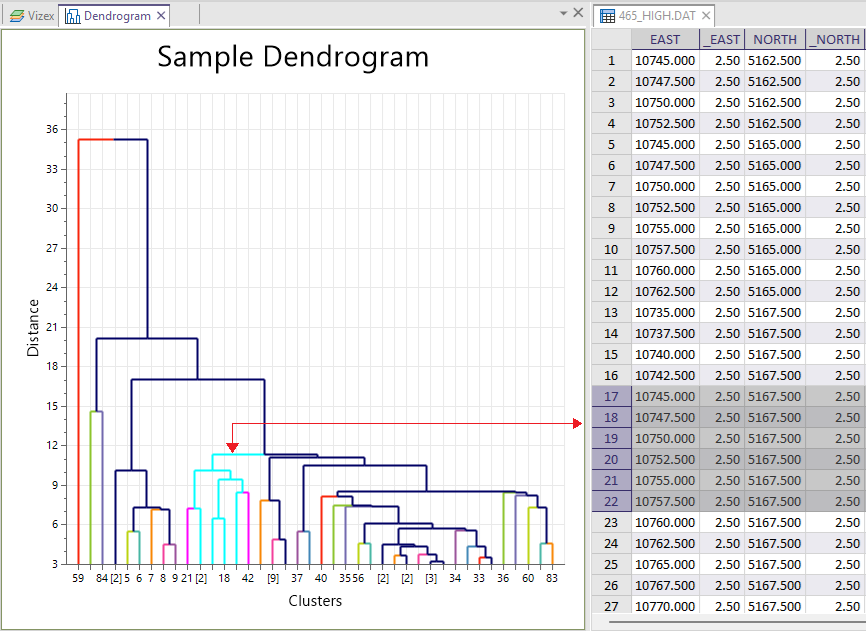
If you have enabled Synchronise Selection for the chart, and opened the data file in Vizex, selecting a branch will also select the data in the open file:
In the Chart | Dendrogram ribbon, along with the Chart Tools common to most charts, the Dendrogram section contains chart-specific tools to configure the Dendrogram.
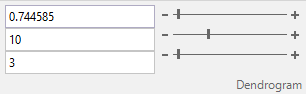
The Merge Distance, Cluster Count and Min Distance values for the chart can be modified by entering values directly, or using the slider control to change the dendrogram displayed. Adjusting Merge Distance and Cluster Count will move the displayed horizontal yellow line to group the clusters as defined, giving each group a different colour. Adjusting one of these values will update the other accordingly.
Changing the Min Distance value will determine the minimum Distance value on the Y axis of the chart. This can be useful if you would like to simplify the dendrogram. The Min distance value is limited so that at most 800 clusters can be shown on the chart.
You can toggle log normal scaling for the Distance axis using the Log Normal Distance button.
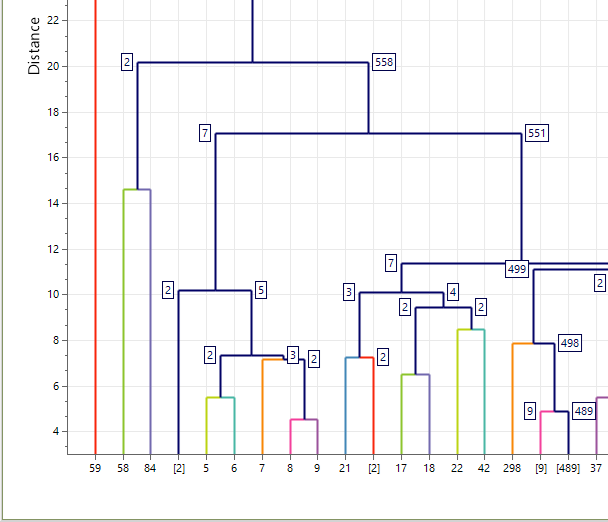
To toggle the display of Sample Count Labels on the dendrogram, click the button in the ribbon. When the button is toggled ON, the chart will show labels displaying the number of samples contained for each dendrogram merge branch.
![]()
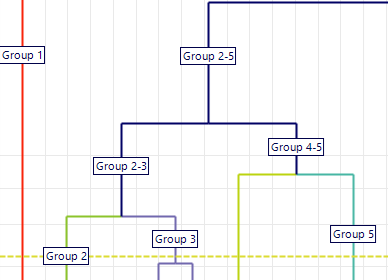
If you toggle the Group Labels tool ON, the chart will show group ID labels on each dendrogram merge branch.
![]()
If you toggle ON the Write Sample Clusters tool, the current grouped clusters (as coloured on the dendrogram) will be written back to the selected Input file using unique IDs.
![]()
When you generate a chart, many of the tools and options on the Chart ribbon are common to most charts. See: Chart Tools