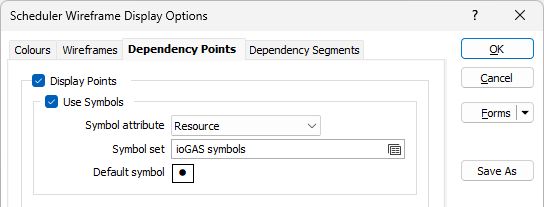
Dependency Points
Dependency Points and Dependency Segments layers are available within the Vizex view when a schedule is opened. This makes it possible to visually check generated dependencies for compliance with the requirements of a particular mining method.
Points which represent the centroids of source tasks are connected by strings to their corresponding destination tasks. Filtering Options include Dependency Type. Display Options include Dependency Type, Connection Type, Lag Size and Lag Type. When enabled, the content of the layer is updated automatically as changes are made in the Gantt Chart, when new tasks are imported and when auxiliary tasks are created or recreated.
Display Points
Select the Display Points check box to set display options for the source task centroids of the Dependency Points layer.
Use Symbols
Select this option to use symbols to render the dependency centroids.
Symbol attribute
Specify the name of
Symbol set
Double click (F3) to select the set that will be used to determine the symbol that will be displayed. The symbol set maps symbols to text strings or numeric ranges. This determines a symbol for each value in the chosen (mapped)
Default Symbol
Double-click in the Default Symbol box to select the symbol to be used when a Symbol
Double-click the Symbol icon to choose a symbol. You can source symbols from any TrueType or OpenType font.
Scale
Select the Scale check box to scale the symbols using a Scaling attribute:
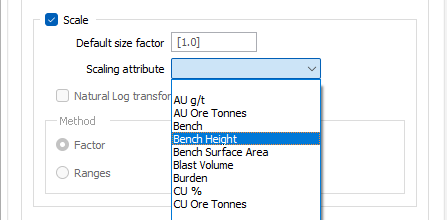
Default size factor
Enter the multiplier that will be used to size all the symbols. They can be made smaller by entering a decimal number less than 1. For example, 0.5 will halve their size. To increase the size, enter a number greater than 1
Scaling field
Select the field that contains the values to be used when scaling is applied. The Use Symbols option must be selected in order for the displayed points to be scaled.
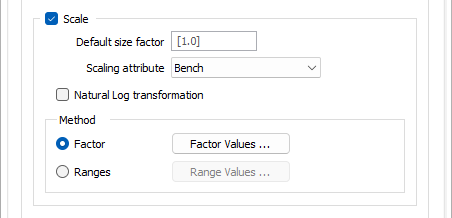
Natural log transform
Optionally, set the Symbol Display Mode to Natural Log Transform.
Method
The Scaling method governs how the size of the symbol drawn at each point is determined. The radius is measured in the same units as the grid coordinates.
- The Factor method calculates a radius proportional to the
value in the Scaling
- The Range method uses a series of ranges defined in a table. The function checks
to see which range contains the value in the Scaling
Select either Factor or Ranges, click on the associated button and enter the required values.
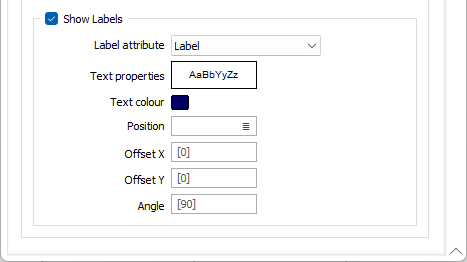
Show Labels
Select the Show Labels check box to label the dependency points by choosing a Label attribute:
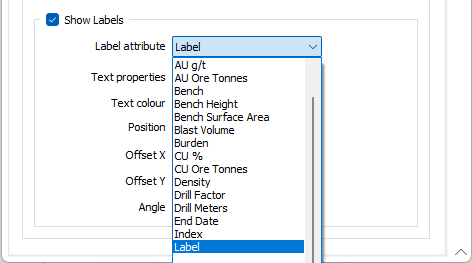
Label attribute
Select a Label attribute. If you leave the field empty, only the label points are displayed.
Text properties
Double-click on the Text Properties Preview box to select a font and set text properties.
Text Colour
Double-click (F3) to select the colour of the text.
Position
The position of the point annotation. Annotation can be located at one of fifteen positions on or around the coordinate point. Double-click (or press F3) to open the dialog box from where you can select a suitable position. See: Positioning Labels
X and Y offsets
To offset the label text, specify X and Y offset values. Offset units are "Character" widths, not grid units.
Angle
Specify the angle (0° to 360°) at which the annotated text will be drawn. An angle of 0° results in vertical (up) text. An angle of 90° is the default and results in horizontal (to the right) text, etc.