Report Generator
![]()
When you use the Report Generator to generate a report, the fields in the input file can be reformatted and re-sequenced before being written to the report. New fields can be created, or be derived using complex expressions, and added to the report. The report data can be filtered and grouped, based on the criteria you specify, and aggregated using various methods.
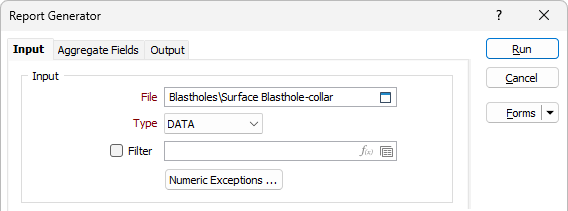
Input
File
Select a file type and double-click (or click on the Select icon) to select the name of the Input file.
Filter
Select the filter check box to define a filter to selectively control which records will be processed. Enter a filter number in the adjacent response. Double click (F3) to see a list of existing filters. Right click (F4) to open the dialog box where you can create a new filter or click the Expression icon to use an expression.
Numeric Exceptions
(Optionally) Use the Numeric Exceptions group to control the way that non-numeric values are handled. Non-numeric values include characters, blanks, and values preceded by a less than sign (<).
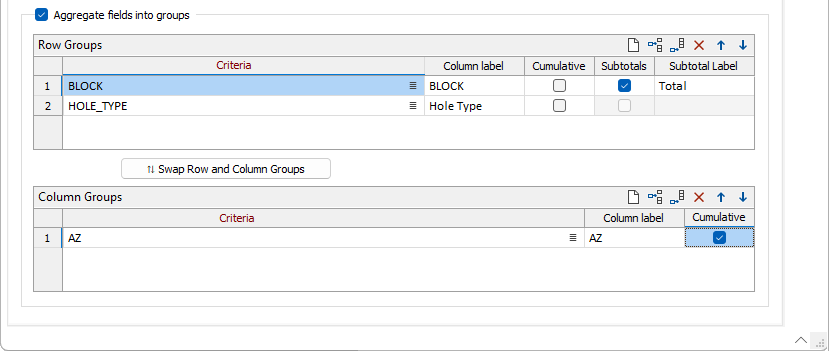
Aggregate fields into groups
Select this check box to specify that the data aggregation should be separated into groups.
Grouping
The Row Groups and Column Groups grids let you specify criteria that separates the data aggregation into groups. For example, if you have a Lithology field that lists different rock types, you can select that field to obtain the aggregated data in separate entries per rock type.
Criteria
You can also use expressions to create groups from arbitrary criteria. For example, the following input expression would generate three groups: "Low", "Medium" and "High", depending on the number in the AuCut12 field:
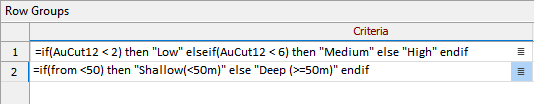
=if(AuCut12 < 2) then "Low" elseif(AuCut12 < 6) then "Medium" else "High" endif
Note: In some cases, expressions used will require an output field name attribute. A warning prompt will be displayed in this instance. For information on supplying output field name attributes in expressions, see Output Field Name Attributes.
To customise the sorting order of grouped entries, a sort order can be specified in the grouping expression itself. See: Sort Order
Column Label
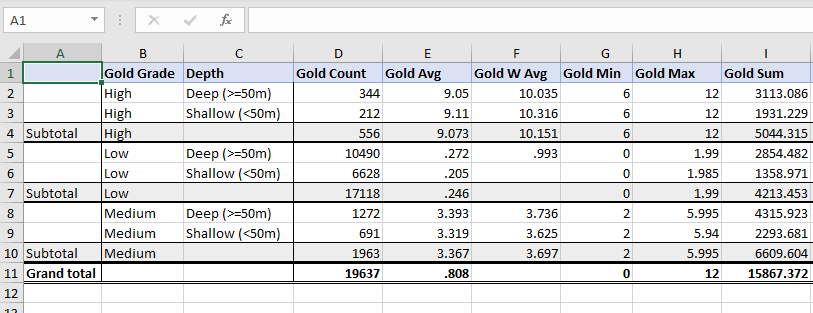
This option decides the column title of this group. In the example of the AuCut12 expression group you might want the label "Gold Grade".
Cumulative
Select this option to set the group to cumulative aggregation; which will determine a value by accumulating the values for the previous groups (as defined by the sort criteria).
Subtotals
If this option is checked, the report generator will generate columns where each group ends and fill these with the sub-aggregations of that group only. In the following example, a Gold Grade group is given subtotals.
In the Excel report, these are marked as grey columns. If several groups are ticked, then they will have subtotals in a hierarchy with the top-most group being the most significant group in the hierarchy.
Subtotal label
Optionally enter a label for each subtotal. The label defaults to "Subtotal" but could be given a more specific name, "Rock type subtotals" for example.
Swap Row and Column Groups
If you click the Swap Row and Column Groups button, the configured contents of the row and column group grids will be swapped.