Charts
One of the key features in Sample Tracker is the ability to check the reliability of the analytical results before the receipt is written to the database. Three types of quality control charts are available from the QC Charts page:
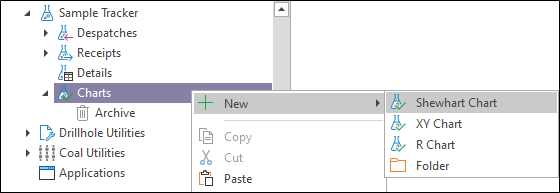
- The Shewhart Chart compares the measured result for a standard sample (as returned by the laboratory) to the actual value of the prepared standard.
-
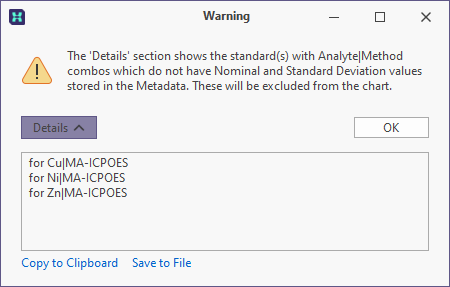
If details of the standard are missing, Analyte|Method combos which do not have Nominal and Standard Deviation values stored in the metadata will be excluded from the chart. The following warning message is displayed. Click on the Details button to see a list of excluded Analyte|Method combos:
- The R Chart provides an alternative way of checking the acceptability of a batch of results, especially in cases where the number of standards is insufficient to produce a meaningful Shewhart chart. The R Chart shows the absolute value of the difference between the result for the QC sample and the result for the original sample, expressed as a percentage of the larger value.
- The XY Chart is used to determine the relationship between two sets of results, e.g. gold and arsenic. Although the XY chart is not strictly speaking a QC chart, it is often used as an additional validation tool.
The charts in Sample Tracker all have more or less the same layout. The chart itself is displayed on the right, while the statistics, data and setup details appear on a notebook to the left of the image.
The notebook has three pages:
- The Monitor page provides an overview of all the relevant statistics.
- The Data page shows the actual data on which the report is based.
- The Setup page is used to customise the appearance of the chart.
Charts can be saved as a default or an advanced report that can be sent to the printer or emailed in PDF format.
Note: The Reports generated for the chart use an image of the chart. The resolution of the image is dependent on the size of the chart window, Micromine Geobank simply takes a "screenshot" of the currently open chart, which it then saves and uses in the Report. To improve resolution, maximise the size of the chart before generating the report.
View QC charts during the Receipt process
The following Chart options are available on the Sample Reconciliation tab under the Despatched Samples panel when a receipt is being executed.
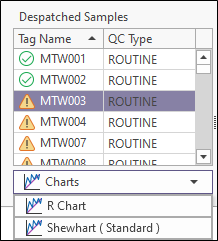
Note that the details of a report will be taken from the details of the current receipt and not the database. Unresolved or unselected samples will not be included in the data used to generate the chart.