Reporting tab
 The Reporting tab is displayed within the context of a given project and enables you to generate any standard or custom report currently available for the project. You can generate a single report or generate multiple different reports simultaneously for the project. Once the generation of a report has completed, you may export and download the report in all its available formats.
For a glossary for Report fields and their descriptions, values and setup options, see: Report Fields (Glossary)
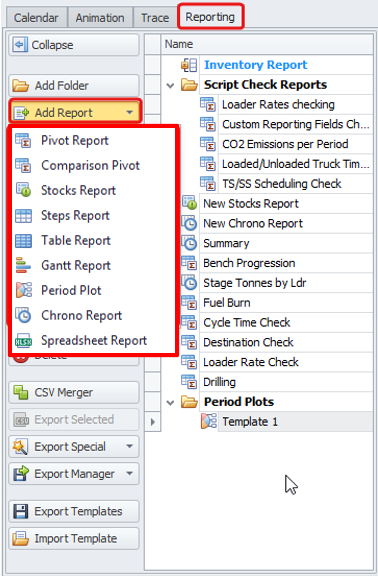
Choose from the report types to learn more about the types of report you can create:
- Pivot Report
- Comparison Pivot
- Stocks Report
- Steps Report
- Table Report
- Gantt Report
- Period Plot
- Chrono Report
- Spreadsheet Report
Reporting Dashboards can be used to combine frequently used charts and tables into a single view that can be saved and easily reopened. For more information, see: Reporting Dashboard
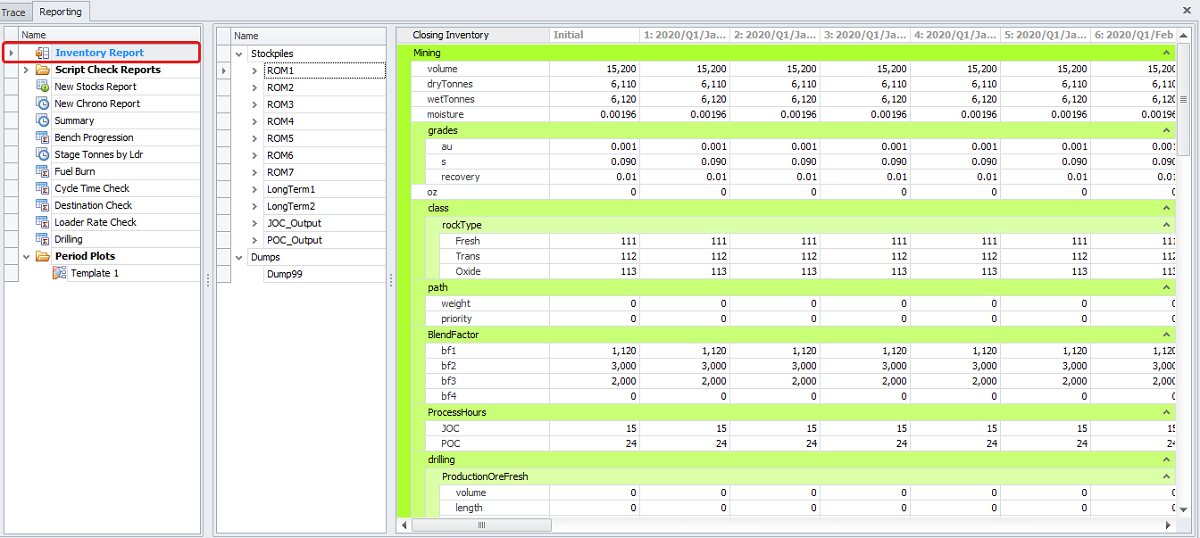
Note, that in the list of Reports on the left you'll also see Inventory Report, which is automatically generated by ATS and not editable by user in this tab. This report type is showing Closing Inventories data by periods.
 You may need to organize your reports by folders.
To do this, press the Add Folder button on the top right and drag and drop relevant report there, holding its header with left mouse button and dropping in the location shown by the blue arrow.
Names of folders containing reports are shown in bold, while empty folders are in regular font.