Period Plot
The Period Plot report is used to present 2D graphical plots of the selected activities in a given time period.
Setup
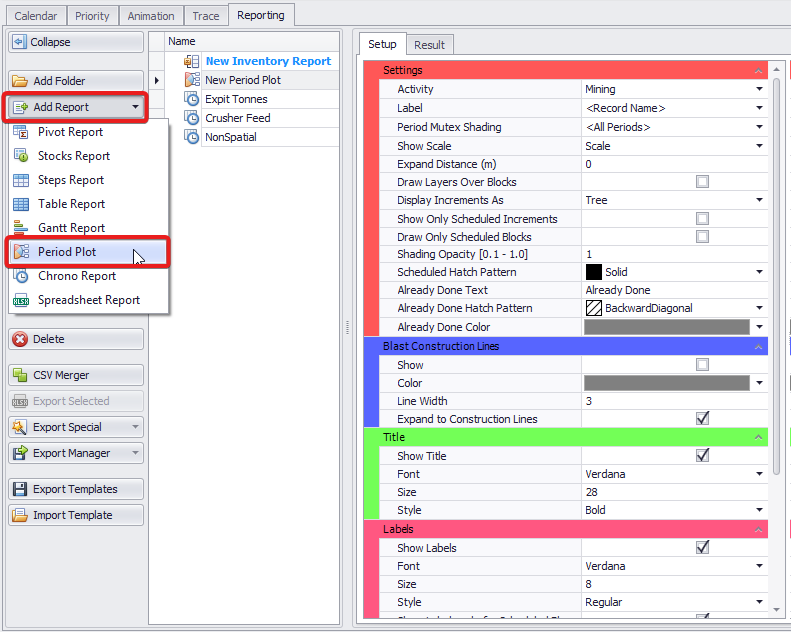
In the Setup tab, set the display parameters for the different components.
Plot Report Setup section
Plot Setup items are explained in the table below:
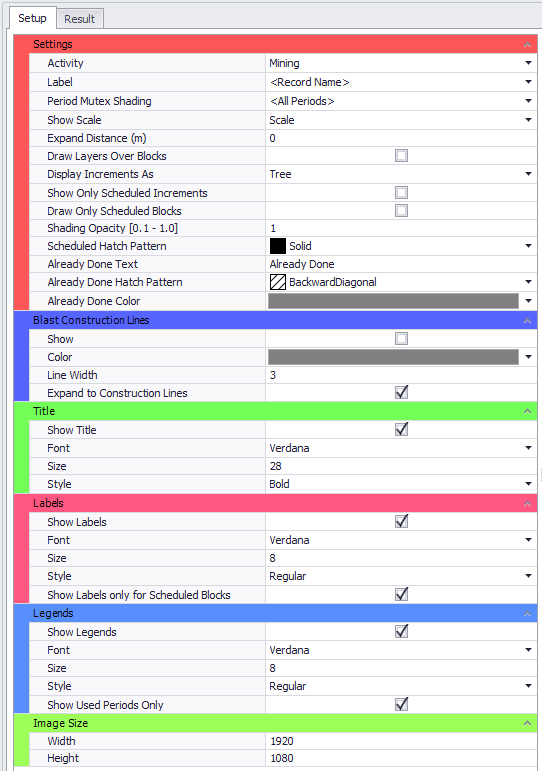
Settings |
Main settings of the plot content. |
|---|---|
|
Activity |
Select the Activities to report, it can be “Drilling” and/or “Mining” (Drilling will only appear if Schedule Drills has been selected under Settings > Configuration Options. |
|
Label |
Use the Labels drop-down to select which labels you want to display on the plot (for example, drilling meters for the ProductionDrilling activity or wet_tonnes for Mining). The default setting is <Record Name>. |
|
Period Mutex Shading |
Select the Period Mutex Group to use for shading. If set to <All Periods>, then the default period shading will be used. |
|
Show Scale |
Select how to display a scale for the plot ("Scale", "Grid", "None"). |

Scale vs Grid display |
|
|
Expand Distance (m) |
Optionally specify Expand Distance, in meters. |
|
Draw Layers Over Blocks |
Flag this option, if you want to draw layers over blocks. Note, that only polyline layers can be displayed. |
|
Display Increment As |
Select how you want to display benches/lifts, in a Tree form or in a List form. |

Tree vs List display |
|
|
Show Only Scheduled Increments |
Flag this option, if you want to display in the tree/list of benches only those that are scheduled in your plan. The increments that are not being worked on during the specified time period will not be included in the list. |

All vs Only Scheduled increments |
|
|
Draw Only Scheduled Blocks |
Flag this option if you do not want to display outlines for unscheduled blocks. |
|
Shading Opacity |
Specify a preferred Shading Opacity, from 0.1 to 1. |
|
Scheduled Hatch Pattern |
Select from the drop-down a preferred Hatch Pattern for the Scheduled Blocks. For better illustration, “Solid” type is recommended. |
|
Already Done Text |
The text for already done (already drilled/charged/mined) blocks, that will be shown in the Legend. The default text is <Already Done>. |
|
Already Done Hatch Pattern |
The hatch pattern of already done blocks. |
|
Already Done Color |
The color of already done blocks. |
| Blast Construction Lines | |
|
Show |
Allows users to display constructions lines associated with each blast. |
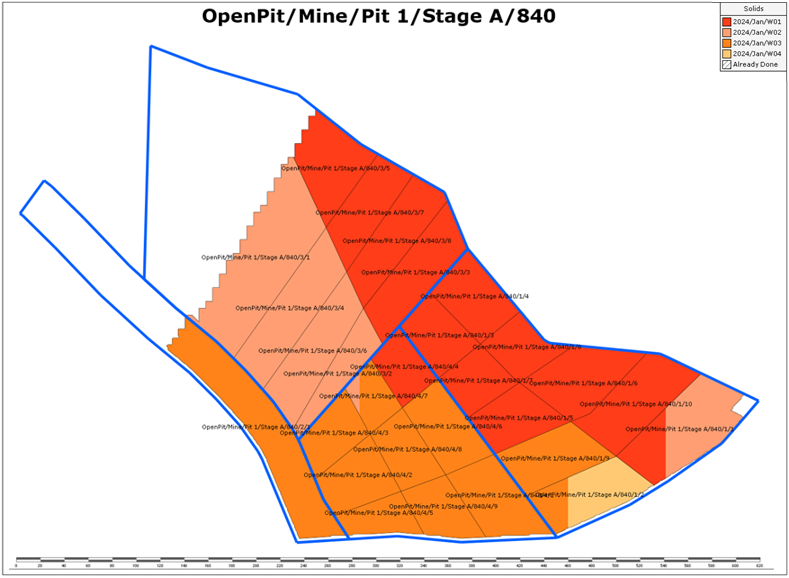
Example of Blast Construction Lines |
|
|
Color |
Select a color for the blast construction lines. |
|
Line Width |
Select the width of the blast construction lines. |
|
Expand to Construction Lines |
Select this option to fit the plot to include the extents of the planned blasts. |
| Title | Title display settings. |
|
Show Title |
Flag to show a selected level Title at the top. |
|
Font |
Title font selection. |
|
Size |
Title size selection. |
|
Style |
Title style selection. |
| Labels | Labels display settings. |
|
Show Labels |
Flag to show a block property (i.e. blast type) over every block. |
|
Font |
Label font selection. |
|
Size |
Label size selection. |
|
Style |
Label style selection. |
|
Show Labels only for Scheduled Blocks |
Flag to show labels only for scheduled blocks. |
| Legends | Legend display settings. |
|
Show Legends |
If Show Legends is ticked, you will see a legend of color assignments by period on the right side of the viewport. |
|
Font |
Legend font selection. |
|
Size |
Legend size selection. |
|
Style |
Legend style selection. |
|
Show Used Periods Only |
Flag to show used periods only. |
| Image Size | Exported image settings. |
|
Width |
Enter the width of the plot. |
|
Height |
Enter the height of the plot. |
Results
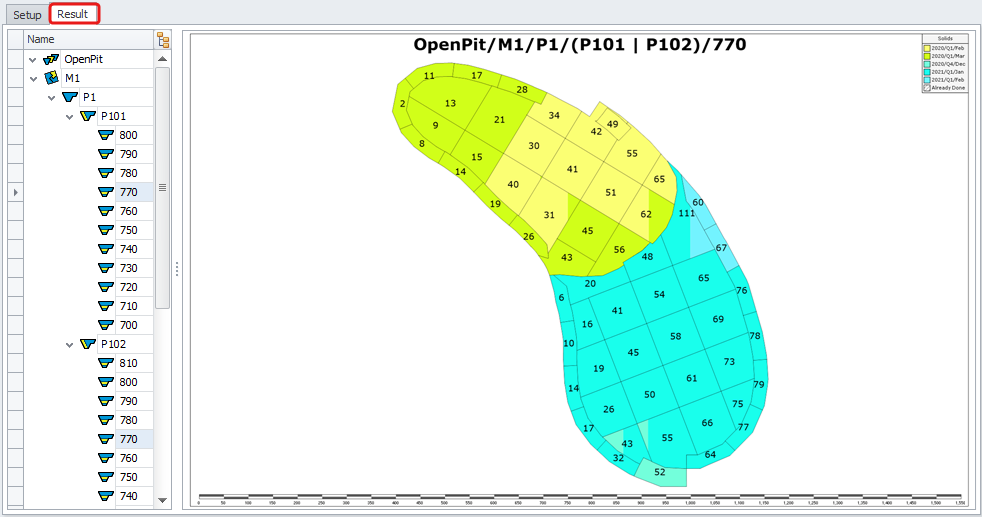
Select a Bench/Flitch or Lift from the tree/list on the left and its blocks will be displayed in the main viewport.
Select the Activity to display from the bottom left.
Select the Period Range to display using the period slider at the bottom of the tab.
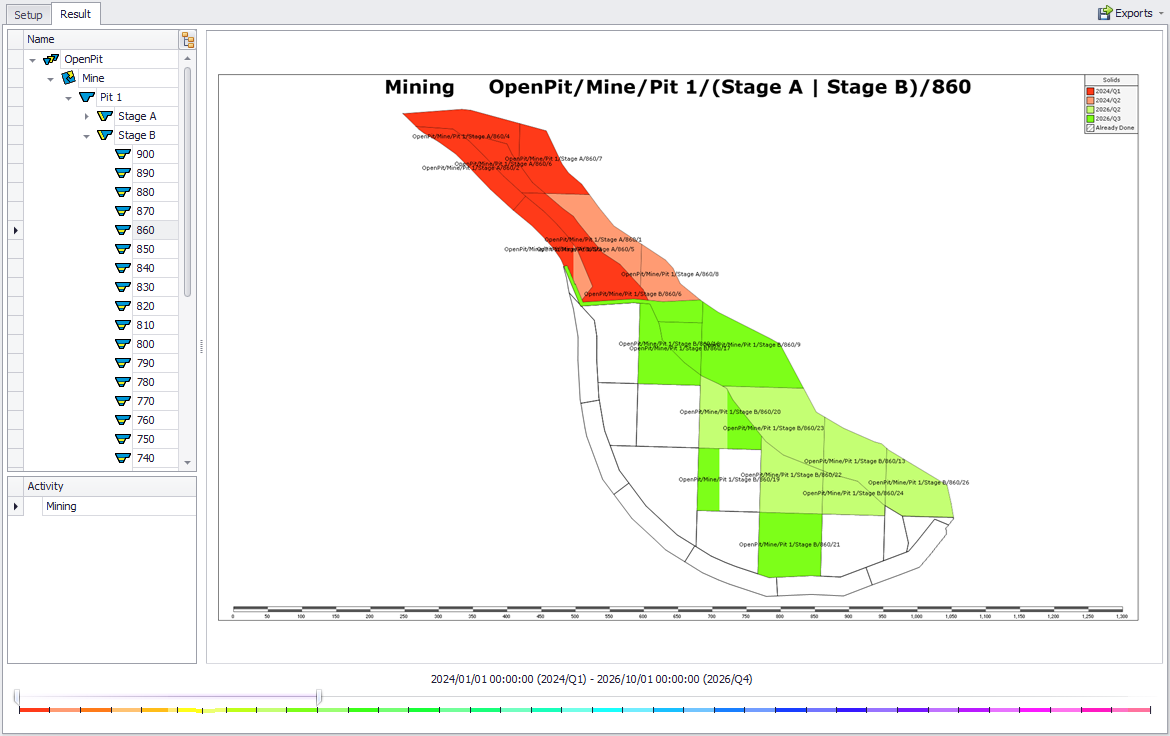
Select the Level(s), Activity and Periods to display in the Result tab
Use the <CTRL> and <SHIFT> keys to select multiple levels from the tree structure on the left.
Note that it is not possible to display the level of the entire pit or stage in a Period Plot. The selection may only contain benches, flitches and lifts.
It is also not possible to display more than one Activity in a Period Plot.
Exporting Results
You can save the displayed plot directly from the viewport by right-clicking and selecting Save from the drop-down.
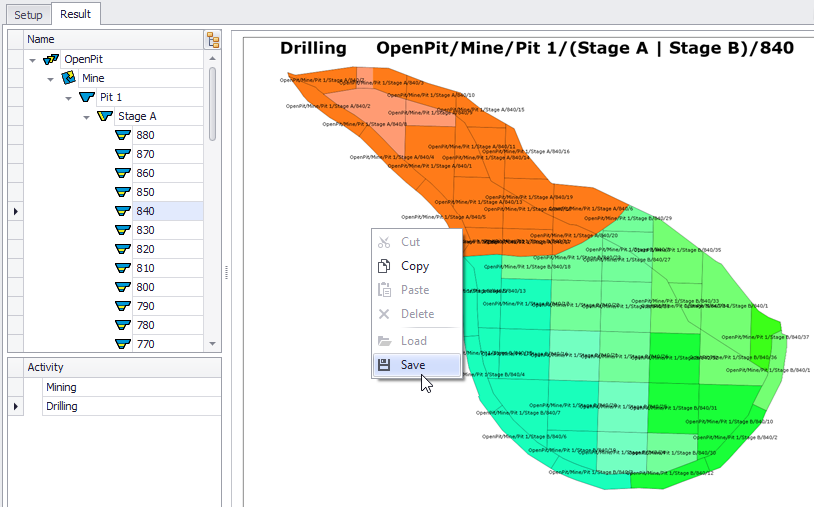
Results tab > right click > Save option
-
In the Save As window specify saving path, name and format of the plot being exported, and click Save.
-
Open the saved file to review results.
Exports allows user to export multiple benches directly to Powerpoint and PDF.
Note this will only export the activity selected.
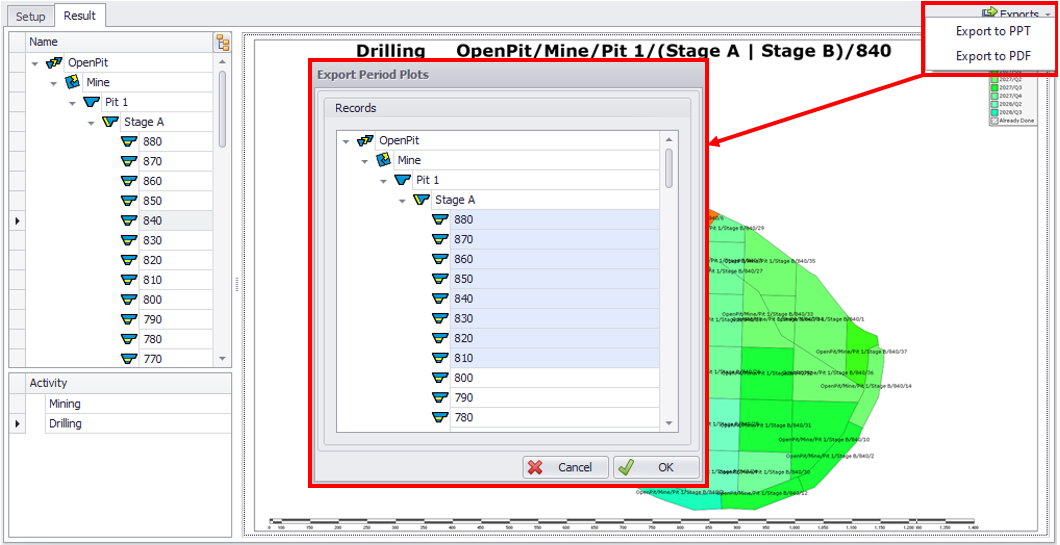
Results tab > Exports option