Blandr Usage Guide
Blend it like Beckham ... Blandr is a tool designed to maximise profitability by taking a schedule output and using a linear solver to decide which product type to blend the output towards and the processing methods to achieve this.
Step 1. Generate schedule output
Step 2. Download Example Table
Step 3. Port information from the schedule output to the table
Step 4. Adjust Table Parameters to suit input
Step 5. Run the Blandr Unsupported Utility
Usage
-
Generate schedule output.
-
Download the Example Blandr Table from the TableDownloader unsupported utility.
-
Port information from the schedule output to the table.
-
Adjust Table Parameters to suit the input.
-
Run the Blandr unsupported utility.
Step 1. Generate schedule output
Scheduling is a complex topic that won’t be covered in this guide. Always make sure that the schedule is up to date and is fit for purpose before running the rest of the tools.
Step 2. Download Example Table
The TableDownloader unsupported utility can be used to download a template table under the Blandr/Example location. This table comes with some default fields that are required for Blandr to run, as well as some examples of the parameters that are also required.
It is recommended that you rename the table.
Blandr Usage Guide (Top)
Step 3. Port information from the schedule output to the table
Blandr is designed to run without a Spry schedule, this is simply the easiest way to import the data. Any way of getting the same information into the table will suffice. This tool will delete fields and then re-add them based on what is in the Custom Fields setup. Backing up the model before running is advised.
A key part of the blending process is understanding what is available to be blended at any point in time. For this reason, it is important to break the schedule results down into time periods (i.e. Year\Month or Year\Fortnight) to control what can be accessed at any given time.
An example of what this looks like in the example project or the Import function in the Blandr unsupported utility can be used to import from schedule output. There are three things that will need to exist before this import can work:
-
A case with a functional output schedule (see Step 1. Generate schedule output)
-
A table to write the information to (see Step 2. Download Example Table).
-
Customs fields in the schedule under a Blandr folder that will be used to understand the different product types:
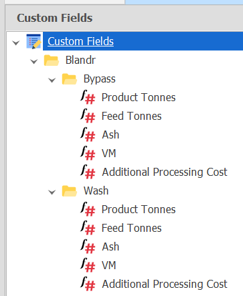
-
The parent folder must be called Blandr, however each folder underneath can be customised to the different processes per site and there can be any number of processes.
-
Each folder will need a Product Tonnes and Feed Tonnes at a minimum, but any other fields can be added or removed, i.e. if the product grades care about CSN, then just add a field called CSN here.
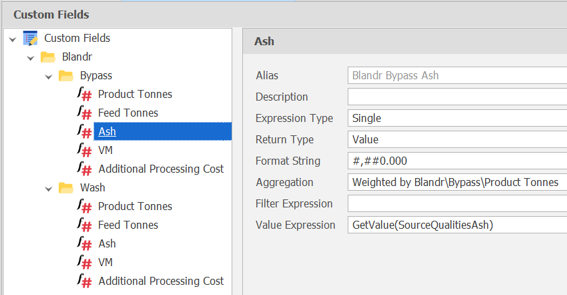
-
All of these Custom Fields will need to refer to the correct data in their expressions and have a suitable Aggregation set (Sum for Product Tonnes and Weight Average for qualities, is normal).
Once these things exist, the Blandr unsupported utility can be run by ticking on Import Data:
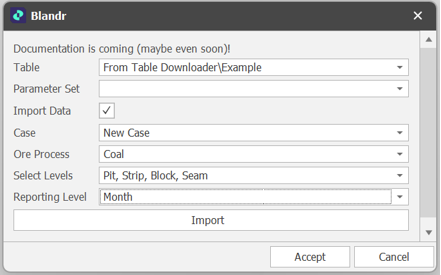
This feature will take the Schedule output in the Case, filter it on the Ore process and then output the results to the specified Table (This should be the Blandr Table instead of the Source Table).
Before using the tool remember to Save the model, all unsupported utilities come with some level of uncertainty and may cause a crash. To speed up results, it is also worth making sure the table isn’t open.
Depending on table settings, you may need to click Recalculate All (on the the Home tab, in the Calculation ribbon group) to see the table data update.
Depending on Levels and the Reporting Level chosen, the output table should loosely mirror the source table, with a Reporting Period at the bottom and with folders added in the fields to match the Custom Fields structure:
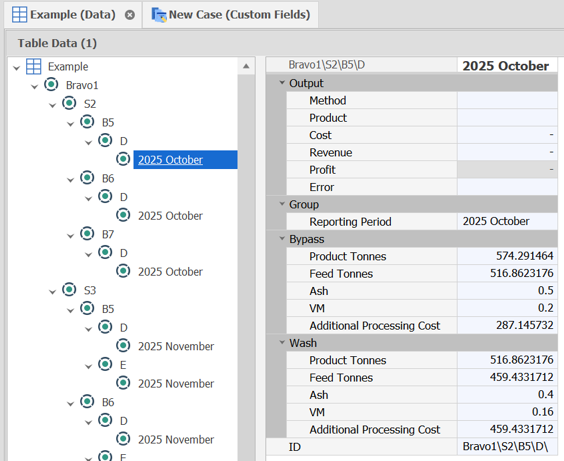
Blandr Usage Guide (Top)
Step 4. Adjust Table Parameters to suit input
The Example Table comes with a set of four parameters that are required in order to run the import.
Processing Methods
The first parameter is Processing Methods:

This will identify which nodes will be used for each processing method, a simple two method example, Wash and Bypass, is shown above.
-
The Range should identify which nodes will fit into each method. In this example all nodes have the option of being bypass or wash, so the range is represented by *.
-
The Name is a text field that will be assigned if that Method is chosen for a record.
-
The Processing Group is what will differentiate different processing limits later on, i.e. how much can be washed over a certain amount of time, which will be different to the amount that can bypassed.
-
The Ore ID Field is the field on the Table that contains the Full Name of the node at the level to be processed ie. Pit\Strip\Block\Seam.
-
The Feed Tonnes and Product Tonnes are the two fields on the table that show how much will enter the process and leave the process, i.e. how much product will be lost if it is washed.
-
The Ore Group Field is the field on the table that will be used to group all of the records together. It is not common to want to blend the entire table together in the most profitable way. It is much more common to want to blend each month in that month's most profitable way or each year, fortnight, etc. If the importer was used to populate the table, then this field will already represent the Reporting Period from the selected Reporting Level.
-
All of the output fields are the fields that will be written back to after the tool is run.
-
The different cost fields will be used to identify the total cost of processing when evaluating profit.
-
The Ash/VM fields will represent any different Quality Mappings, set up in the next Parameter, that are used to identify different product gates. These can be added or changed in the Settings of the parameter if there are more or less qualities that need to be considered.
Quality Mappings
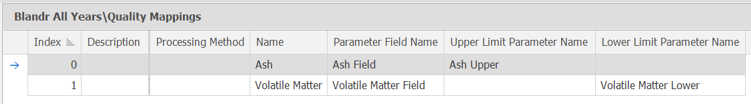
The second parameter is Quality Mappings:
-
This parameter allows links to be created so that quality gates can be used to define products, i.e. product1 has an upper ash limit of 10%, while product2 has a limit of 12%.
-
The Processing Method allows for delineation between limitations for different methods.
-
The Name is the way of identifying what the row refers to in plain English.
-
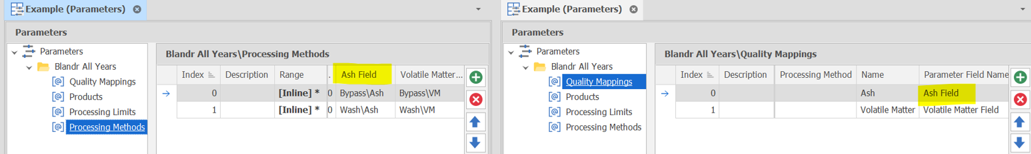
The Parameter Field Name is a direct representation of the column in the Processing Methods parameter that the row will read its value from, i.e:
-
The Upper and Lower Parameter Names is how the next parameter will refer to the Ash fields and choose different products.
Products
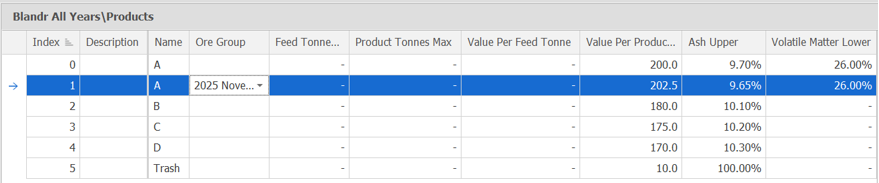
The next parameter is Products:
-
This parameter is where quality requirements are set for different product types, as well as the values that those product types can be sold for. The above example illustrates how product types can vary over time, with 2025 having slightly different parameters for product A.
-
The Name of the product type will be printed in the output for each node on run to show which product type it fit into.
-
The Ore Group is the way that products can be controlled for different groups. If the ore groups are set at a Year/Month level, then the ore group will also have to be Year/Month, and just including Year will not encapsulate all of the months.
-
Feed Tonnes/Product Tonnes max shows a maximum number of each of the products, with no number representing no maximum.
-
Value should be entered into either the value per product tonne OR value per feed tonne.
-
The upper and lower limits are what differentiates the different products based on qualities. These can also be changed in the settings of the parameter to fit the correct purpose of the model.
Processing Limits
The last parameter is the Processing Limits:
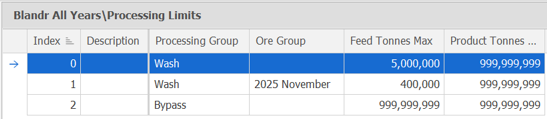
This is where limits are placed on how much volume can be fed or produced by any of the processing methods. In a similar fashion, these can be delegated specifically for certain Ore Groups or left blank to encompass every ore group.
Step 5. Run the Blandr Unsupported Utility
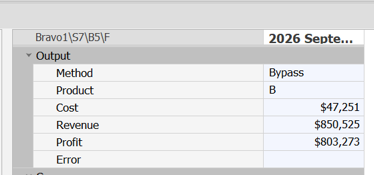
By simply opening the unsupported utility, selecting the table and the desired group of parameters, clicking Accept will run and print outputs to maximise profitability for the data set. The output shows the selected method and the product category that the record fell into, and will look like this:
Blandr Usage Guide (Top)