Rimpull
Rimpull is the force available between the tyre and the ground to propel the machine (limited by traction) and it is measured at the wheel so includes all transmission losses. Rimpull curves are used to determine the maximum speed attainable, gear range and available rimpull when machine weight and effective grade are known.
Micromine Spry has a truck database which includes over 100 common mining truck/engine combinations. If you wish to enter your own data, it is important to note that scales and units on rimpull charts range from linear to logarithmic and can use kg force, kN or lb force.
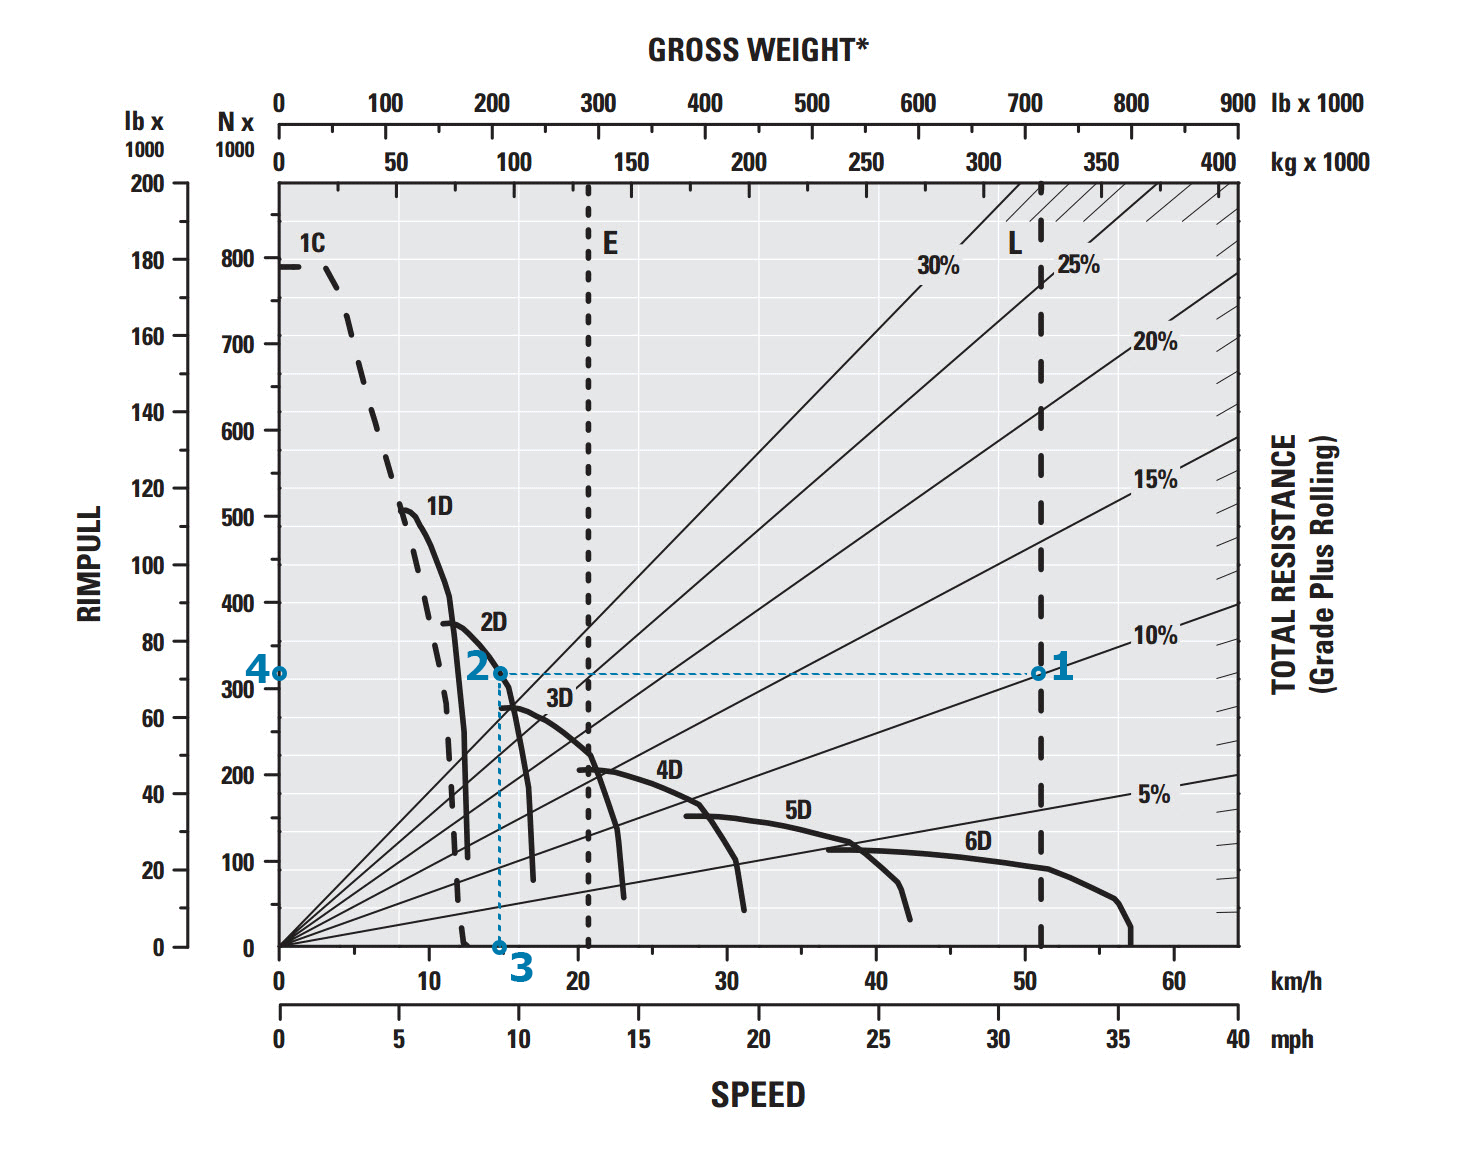
Example: If a fully loaded (324t) Caterpillar 789D travels up a 10% effective grade, there are two ways to determine the maximum speed attainable. Manually reading a rimpull graph involves
- 1. Finding the effective grade (10%)
- 2. Drawing left to the rimpull graph (~320,000N rimpull, 2nd gear)
- 3. Drawing down to the speed (~14.8km/h)
If no grade lines are available calculate the rimpull by multiplying the effective grade by the vehicle weight. In this example, 324,319 kg * 10% = 32,432 kgf or 318,048N (see 4. Below) and draw right.
Retard/brake performance curves determine the speed that can be maintained when the truck is descending a grade with retarder applied. For most trucks what this means is there are 5 or 6 (depending on gears) maximum descent speeds a truck can maintain. You can read a retarding curve in the same way as a rimpull curve.
Editing rimpull data and retard data in the application is generally not required (or recommended), and small changes generally do not effect results by a significant amount. If your schedule throws an error due to rimpull or retard data not being sufficient, you may need to look at your haul profile to make sure it is accurate rather than changing the rimpull.