Colour Coding
When viewing Drillhole data in the Viewer, intervals can be displayed using settings from Colour Sets. Configuring colour display for drillhole data is outlined in Viewing Drillholes.
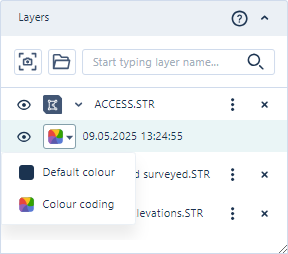
For other objects opened in the Viewer, the Default colour can be set for display, or Colour coding can be configured.
The Basic colours, Advanced and Custom tabs for the Default colour option provide increasingly expansive colour palettes to use for selecting your default colour.
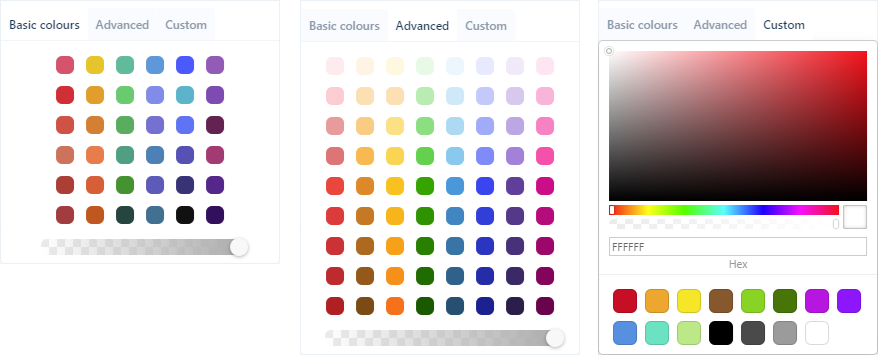
Each palette also features a transparency slider which determines how 'see-through' an object is in the display.
If you select the Colour coding option, the Colour coding panel will open.
![]()
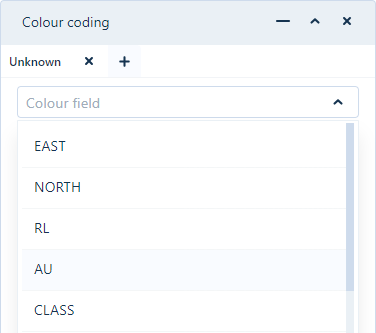
The Colour field drop down contains a list of the attributes available in the selected file. If you select a field from the drop down, the colour coding you configure will be applied to that field in the display.
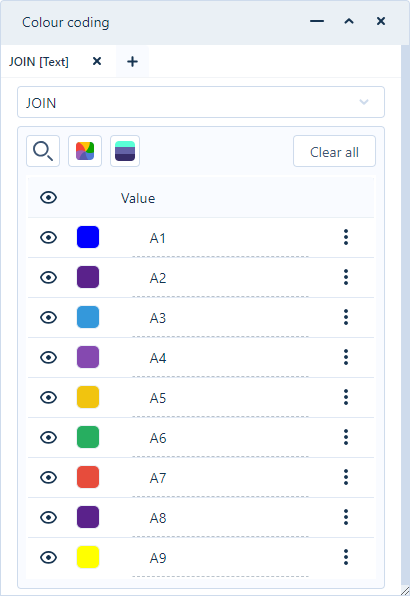
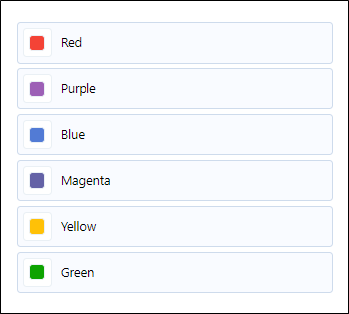
When a text field has been selected, the available values for the field are assigned a colour layer in the dialog. For each value, a colour can be assigned.
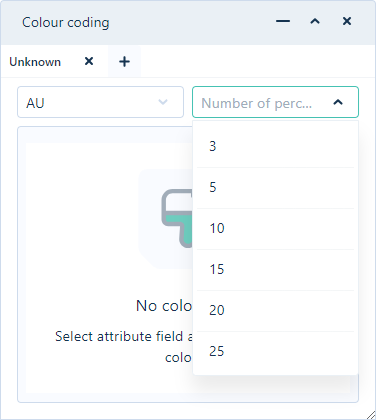
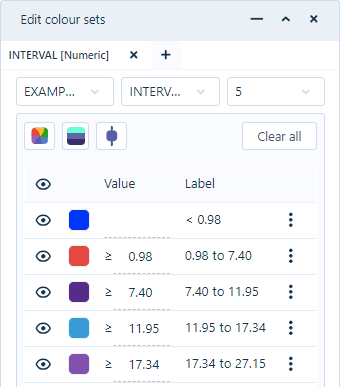
For numeric fields, the Number of Percentiles drop down is enabled. You can select the number of interval percentiles to be displayed in the Viewer for the file.
For every percentile displayed, a colour interval is created and to each layer, a colour can be assigned:
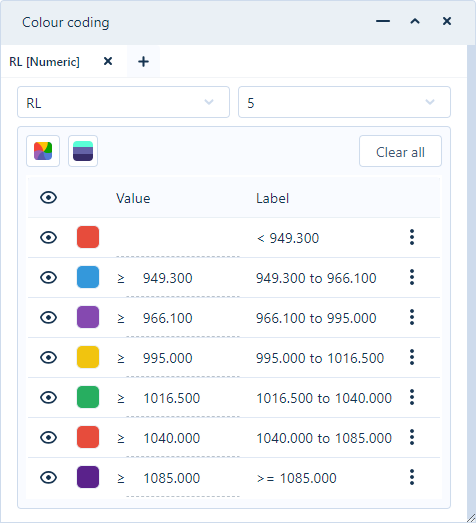
You can modify the intervals in the grid by adding or deleting intervals using the More menu at the right of each interval:

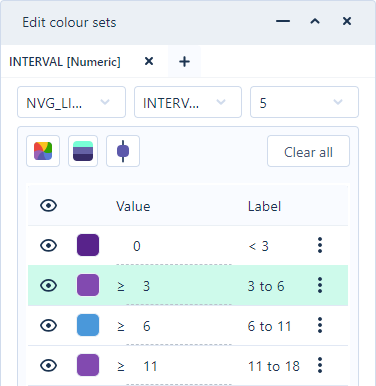
If you select the Insert row after option, a new interval row will be added to the list in the Colour sets panel. You can enter a Value for the new interval and the application will calculate the remaining values:
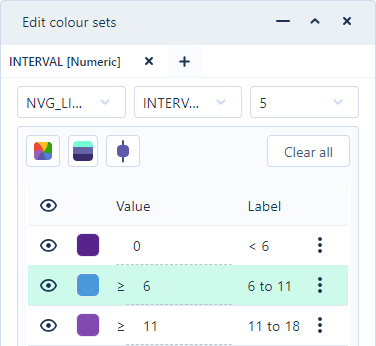
If you select the Delete row option, the selected row will be removed from the interval list and the values will be recalculated.
The Apply Random Colour  button applies a random colour to all bodies inside a wireframe version. This makes it easier to see the difference in closely located geometry in Layer element.
Note: Applying a random colour to the object will limit the colour selected to a small set of colours:
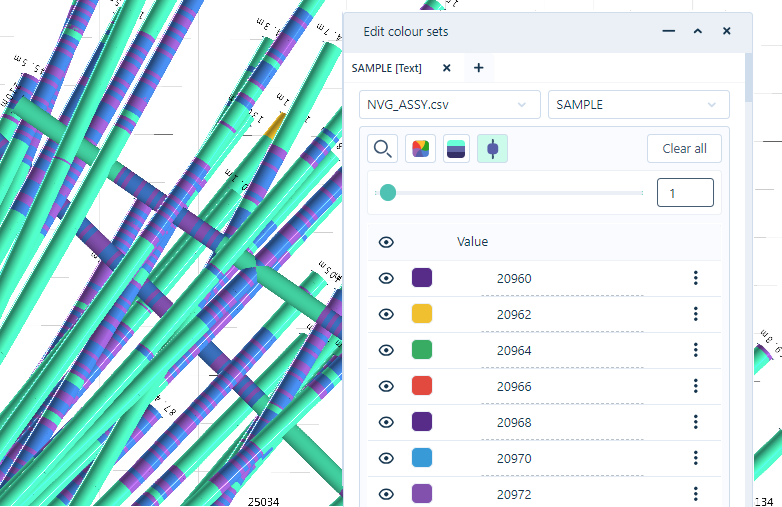
Colour ramping automatically generates graduated colours between the start and end colours of the Numeric or Text intervals colour set. You can automatically set the colour ramp for the intervals using the Ramp Colours button. This will assign the graduated colours for each code in the drillhole data, using the colour for the first code and the colour for the last code for reference:
With a Text interval colour set open, you can use the Search icon to find a specific entry using a keyword:
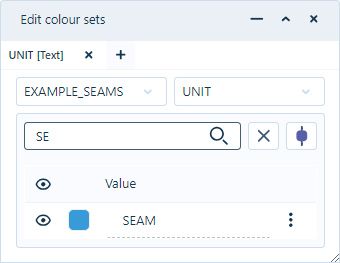
Text you enter in the Search field will filter the interval list to help you find the required entry.
For more information on editing colour sets, see Colour Sets.
The Solid View  button provides solid trace visualisation of the drillholes in the Viewer.
Solid traces show colour-coded downhole data or specific numerical ranges and character codes. Drillholes are displayed in a 3D view in the same manner as the Solid trace Vizex layer in Micromine Origin & Beyond with the default parameters.
When toggled ON, the Solid Trace button activates the Solid Trace Radius slider. Using the slider, or entering a value in the field provided, you can determine the displayed radius of the solid trace to a maximum value of 50:

You can toggle Solid View OFF by clicking the button again.
If required, you can use the Vertical Exaggeration control at the bottom right of the Viewer to change the Z scale for the visualisation.
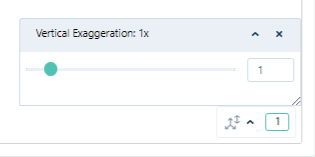
Adjusting the vertical exaggeration is useful when visualising large areas with short traces and a very small Z range such as alluvial ore bodies and stratiform deposits such as coal. Without an adjustment to the Z dimension, it is sometimes difficult to recognise that there are two polygons very close together.
When you select a drillhole in the Viewer, the Collar properties panel is opened with the details of the collar displayed:
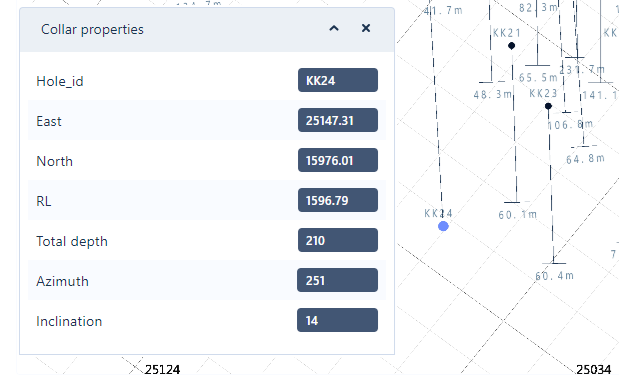
The Collar properties panel displays any existing attributes for the drillhole, such as the coordinates, Azimuth and Inclination.