Setup
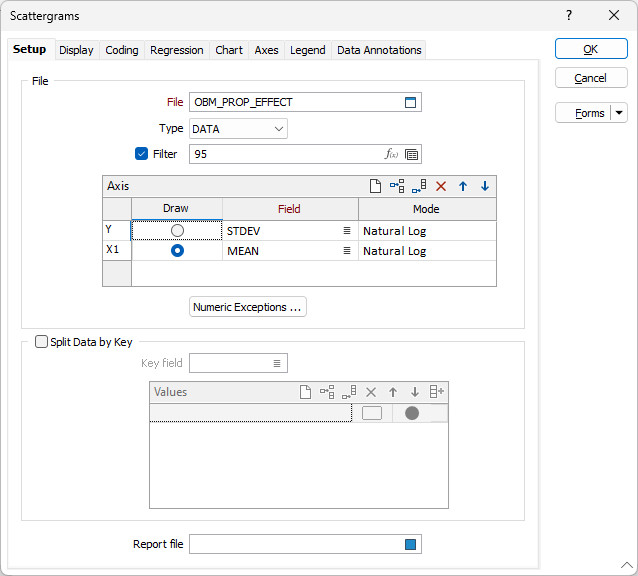
On the Setup tab of the Scattergrams form, specify an input file, the axis fields in that file and optionally choose whether to split the data by key field values.
File
Select a file Type and double-click (or click on the Select icon) to select the name of the source File. You can also click the Pick from Vizex button to collapse the form and interactively select a layer containing the file to be inserted and return to the form.
If required, define a Filter to selectively control which records to process.
Axis
Use the Axis grid to enter (or double-click to select) the name of the field that will be used to plot the Y axis, and the names of the fields that will be plotted along the X axis.
You can use the mouse with the SHIFT or CTRL key to multi-select the fields. This will add multiple rows to the grid simultaneously, for each selected field.
Note The fields you multi-select may overwrite existing row/field selections. The safest way is to append a row to the list before multi-selecting fields.
If more than one X field is specified, you can specify which field to draw.
Select a display mode for the Y axis field.
Select a display mode for the X axis field(s).
Note that default labels in charts often use the input field name to label the data being plotted. If these fields are expressions, then the expressions will be used as the label text. To avoid this, you can use an additional attribute to define the label. See: Output Field Name Attributes
You can use field values directly or you can take natural logs of the data before it is displayed. To use the graph values as they occur, choose NORMAL. Choose NATURAL LOG to convert the values in the X or Y fields before they are displayed.
Numeric Exceptions
(Optionally) Use the Numeric Exceptions group to control the way that non-numeric values are handled. Non-numeric values include characters, blanks, and values preceded by a less than sign (<).
Split Data by Key
Select this check box to split data according to the values of a key field.
Key field
Double-click, or click on the List icon, to select a field in the input file.
Key value
On each row of the grid, double-click in the Key Value column to select a field value:
![]() Auto-fill of the keys grid will auto-populate the grid with all unique values (up to a maximum of 30) of the supplied key field, each with a different colour.
Auto-fill of the keys grid will auto-populate the grid with all unique values (up to a maximum of 30) of the supplied key field, each with a different colour.
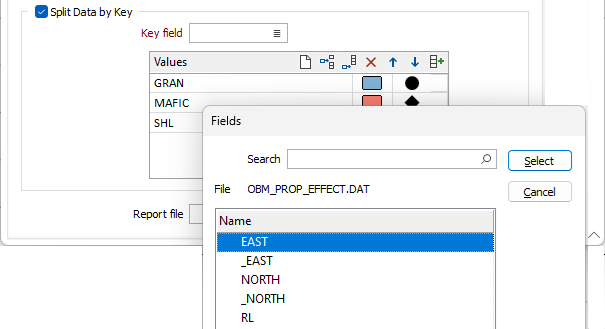
Accept the defaults or select a colour and a symbol for each key group.
Use the buttons on the local toolbar to Manage the rows in the list.
Note:
- If Multi-chart Layout is selected (on the Display tab), a graph will be created for each key group.
- If Display Regression Line is selected (on the Regression tab), a regression line will be displayed for each key group.
- If you have chosen to Split the data by key field values, the Symbol Coding and Colour Coding options on the Coding tab are not enabled.
Report file
Whenever you create a report file in a multiple regression (where there is more than one X-axis field), interactively changing the X- or Y-axis field names will append the new combination to the report. This facility provides a way to quickly accumulate the reports corresponding to each X/Y field combination. However, the Report file will grow very quickly, so you should avoid using a Report file until you have finished exploring your data.
Enter (double-click or click on the Select icon) to select the name of the Report File that will be written as a result of the process. To see the contents of the file, right-click in the file box and select View (F8).
The Report Viewer is opened for any Statistical function that generates a Report file. Click the Form button on the Viewer toolbar to re-open the form, adjust the parameters of the Statistical calculation, and then choose to overwrite or append to the output in the Viewer window.
Forms
Click the Forms button to select and open a saved form set, or if a form set has been loaded, save the current form set.
OK
When you have set display options and customised the appearance of the chart, click the OK button to run the regression.
Various statistics are calculated and displayed in a Properties pane to the right of the chart. If you have specified a Report file name, a summary report containing the calculated statistics is also generated.
In addition to reporting the standard deviation and mean of the Y variable, the coefficient of determination (R2) and the between groups variance (S2) are also reported.