Quick Summary
![]()
By default, this function produces a simple report containing basic properties of the data, however you may optionally choose to generate a detailed statistical summary and/or a separate quantile report. The reports are formatted as regular Micromine data files.
To use this function, specify the name of the File and the Field(s) to calculate. You may optionally specify a Weighting field, allowable Minimum and Maximum values, and apply an on-the-fly upper Cut value.
Input
File
In the Quick Summary form, select a file type and enter (or double-click to select) the name of the file containing the source values. If required, define a filter to selectively control which records will be processed.
Weighting field
Optionally enter (or double-click to select) the name of a Weighting field. When a Weighting field is applied, weighted means, standard deviations, confidence intervals and variances will be written to the Statistical Summary Report file. If no Weighting field is specified, un-weighted values will be written to the file.
Key field
If a Key field is specified, a Key column is added to the report files and a record is generated for each unique Key field/Summary field value combination.
If the Include "ALL" row(s) check box option is also selected, records with an "ALL" key will also be created to show the statistics of the whole field, for each Summary field.
Summary Fields
Double-click (or click on the Select icon) to select the name of the fields for which you require a statistical summary or a quantile report. Dynamic field expressions are supported. See: Expression Editor
Minimum, Maximum, and Cut values
Specify a Minimum value, a Maximum value, and a Cut value for each field. If you enter a value in Minimum, all values below it will be excluded from the calculation. The same applies to values greater than an entry in Maximum. Values greater than your entry in Cut value will be reduced to that entry before the calculation is made.
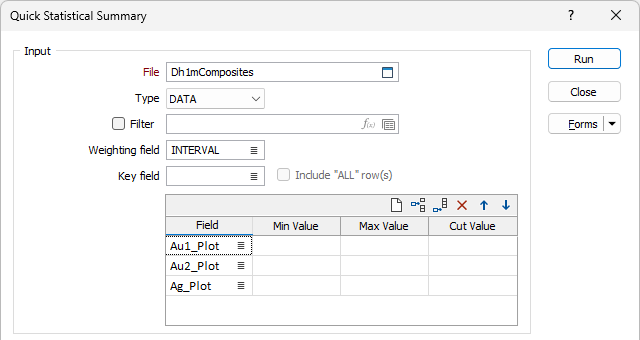
Use the buttons on the local toolbar to Manage the rows in the list.
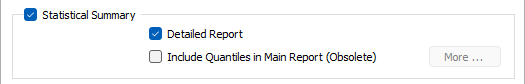
Statistical Summary
Detailed Report
Select this option to write a detailed report which includes the coefficient of variation, mode (and associated bin size), median, inter-quartile range, no. of outliers, and alternative means/std devs, etc. Skewness (Symmetric, Moderate negative skew, Strong positive skew) and Kurtosis (Normal, Peaked, Flat) are reported in qualitative terms. See: Skewness and Kurtosis
Include Quantiles in Main Report (Obsolete)
The legacy behaviour of writing chosen quantiles to the main report (the statistical summary), with parameters specified on a separate dialog, is obsolete. Alternatively, select the Quantile Report check box option (see below).
Quantile Report
In addition to, or instead of, writing a statistical summary report, select this option to write quantiles to a separate report.
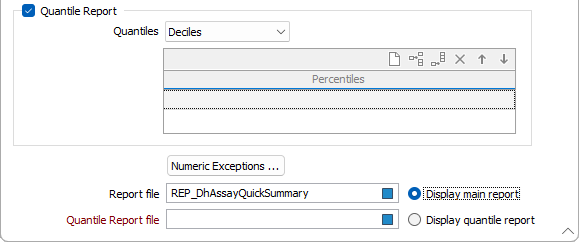
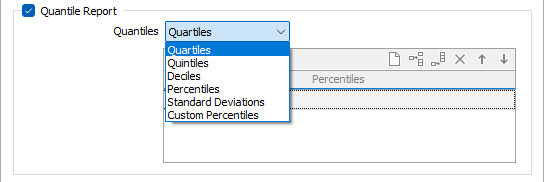
Quantiles
Select the Quantiles you want to report on.
Quantiles are values extracted at regular intervals from a dataset that has been sorted into increasing order. Calculating quantiles involves dividing the sorted data into equal-sized subsets and then identifying the values at the boundaries between subsets. Quartiles are useful for summarising and comparing data and have the advantage of being less susceptible to outliers than the mean.
For example, dividing a sorted dataset into four quantiles (which are then referred to as quartiles) will split it into groups that each contain 25% of the data. The data value at the boundary between the first and second group is known as the first quartile, and it represents the point below which 25% of the data occurs. The second quartile, also known as the median, has 50% of the data below it, the third 75%, and the fourth 100%.
Along with quartiles, other combinations are quintiles (five subsets), deciles (10 subsets) and user-defined percentiles (100 subsets).
Numeric Exceptions
(Optionally) Use the Numeric Exceptions group to control the way that non-numeric values are handled. Non-numeric values include characters, blanks, and values preceded by a less than sign (<).
Report file and Quantile Report file
If you have chosen to generate a Statistical Summary and a Quantile Report file, enter (double-click or click on the Select icon to select) the name of the Report Files that will be output as a result of the process. To see the contents of the files, right-click in the file box and select View (F8).
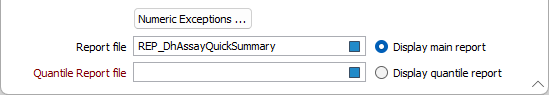
The Report Viewer is opened for any Statistical function that generates a Report file. If you have chosen to generate both reports, the Display main report and the Display quantile report options allow you to select which report to display in the Report Viewer.
Note:
- If you have chosen to generate a single report, the appropriate Display option will be selected automatically.
- If file names are specified for both reports, both reports will be updated at run time, but only the selected report will appear in the Report Viewer.
Click the Form button on the Report Viewer toolbar to re-open the form, adjust the parameters of the Statistical calculation, and then choose to overwrite or append to the output in the Viewer window.
Run
Finally, click Run to run the function.