New
![]()
The Drillhole Database form is displayed whenever you create or edit a drillhole database:
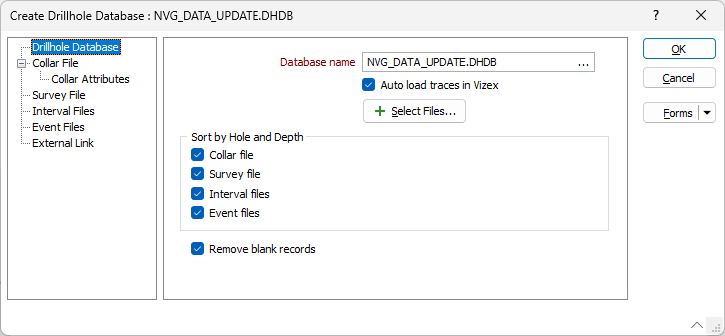
If downhole data is being used, then data in a Collar file and (optionally) a Survey file will be imported and used to generate trace coordinates. External interval and Event files can also be associated with the database. The fields in these files can be used to classify and colour code the trace display.
Database name
Enter the name of the new drillhole database (or Trench Database). Alternatively, double-click (or click on the ellipsis) to select from a list of databases in the current project.
You will be prompted to overwrite the database or cancel.
You can also press F5 to create a new database. Press F4 to edit a database you have selected.
Auto load in Vizex
Select this option to open the file in Vizex (if applicable for the type of Output file). Text files which contain non-spatial data will not be loaded.
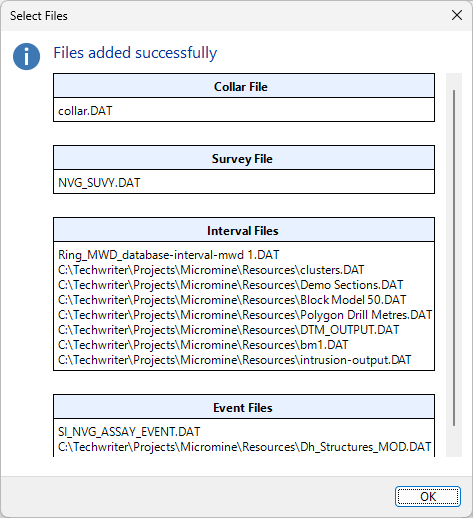
Select Files
If you click the Select Files button, you can select a database, and multiple collar, survey, interval and/or event files to add to the form. Information for the files added successfully will be autofilled on the relevant tabs. You will be notified that the files have been added, and a prompt will display the type and name of each file (Collar, Survey, Interval, Event) in the database.
Sort by Hole and Depth
Select the check box for each associated drillhole file for the database to sort by Hole ID and From/Depth - Collar, Survey, Event and/or Interval.
Remove blank records
Select this option to ensure no blank records are added to the drillhole database to be created.
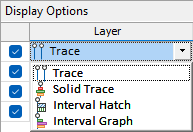
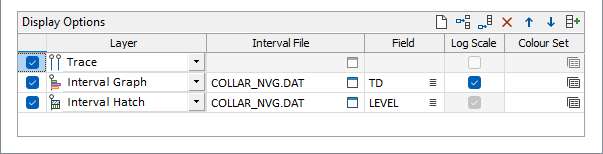
Display Options
In the Display Options grid, you can configure the layers in the data to be automatically loaded in Vizex when the database is created, imported or modified.
Use the buttons on the local toolbar to Manage the rows in the list.
Multiple layers for display can be configured in the grid using the Layer drop down for each row you add to the grid.
When a layer has been selected, it is enabled by default. You can disable the display using the check box.
For each layer you add to the grid, you need to select an Interval File associated with the database from the field provided.
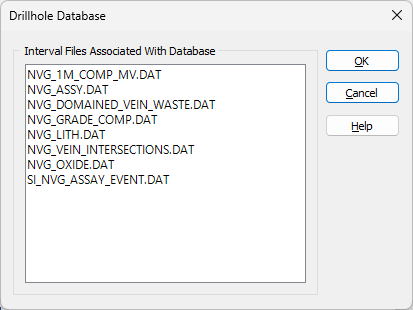
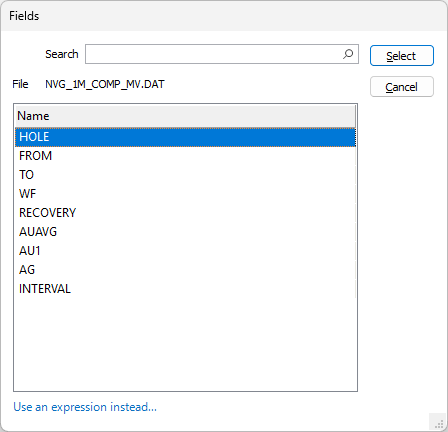
When the Interval File is selected, you can select the Field for display. If you click the list icon, the Fields dialog is opened with a list of the available fields displayed:
When you add/change an interval file (or multiple), Display Options are automatically filled. The Add Files button will also automatically fill the grid, but the drillhole database as a whole, rather than only the files selected, will be considered. An Autofill button is also available in the toolbar for the Display Options grid.
Multiple fields can be selected from the Fields dialog using Ctrl or Shift to select all the required fields. The first field name will automatically populate the Field box in the Data Summary.
Dynamic field expressions are supported. Click on the Use an expression instead link to open the Expression Editor:
For Solid Trace and Interval Graph layers., you can select whether to apply the size on a Log Scale. For Trace and Interval Hatch layers, the Log Scale is required and cannot be disabled. Trace layers do not require the configuration of any other details.
For each layer you add to the grid, you can specify a Colour Set to determine the colours used for displaying the data in Vizex. Double click in the Colour Set field to select a colour set of the appropriate type. To create a new set, right-click in the input box and select New from the right-click menu.
Forms
Click the Forms button to select and open a saved form set, or if a form set has been loaded, save the current form set.
OK
Click OK to save the properties of the database you are creating or editing.