3 Parameter Log Normal
3 Parameter Log Normal estimation is only enabled in the chart display when the scale on the Input tab of the Scale form has been set to NATURAL LOG (Ln).
|
|
Click the 3 Parameter Log Normal button on the Chart toolbar to generate an additive constant which will remove bias from a near log-normal sample. |
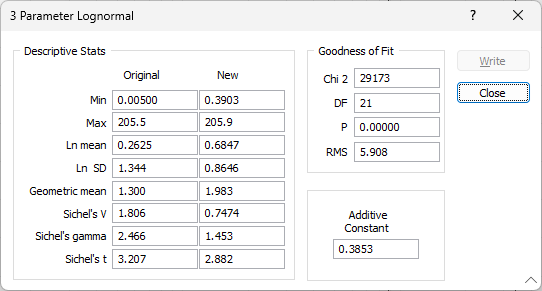
Additive Constant
The additive constant is the amount needed to normalise (log-normalise) the data set. After running the calculation, the additive constant is shown together with a series of measures of how well the modified data fits the log-normal population using chi square, degrees of freedom, a P value, and an RMS value.
When 3 Parameter is selected, a message box will appear on screen while the function processes the data. Once the calculations are complete, another message box, headed 3 Parameter Log normal will appear, and the modelled data will be shown on the graph. The 3 Parameter message box shows a table with columns for both original and new values of: Minimum value, Maximum value, Ln mean, Ln std deviation, Geometric mean, Sichel’s t estimator, Sichel’s V and Sichel’s gamma.
Descriptive Stats
|
Minimum value |
The lowest data value used in the chart. |
|
Maximum value |
The highest data value used in the chart. |
|
Ln mean |
Ln mean is the mean of the natural logs of the values in the chart. Geological data is often distributed log-normally. See: Ln mean |
|
Ln std deviation |
The log-normal standard deviation is, like its more common counterpart the standard deviation, a measure of the spread of the data. As with the Ln mean it is derived from theory. See: Ln std deviation |
|
Geometric mean |
The Geometric mean is the median value of a log-normal population. As with the median for a Normal population, the geometric mean will be the same as the Ln mean if the data is log-normally distributed. See: Geometric mean |
|
Sichel’s T Estimator, Sichel's V, Sichel's Gamma |
Sichel’s t estimator is another measure of the mean of log-normally distributed data. It is derived using maximum likelihood theory and corrects for the bias in the Ln mean if the number of samples is small. See: Sichel’s t estimator |
Goodness of Fit
|
Chi-Square Test |
Chi-square is a statistical test that measures the ” goodness of fit” of fit of data. That is it measures whether the set of data under investigation (the sample) matches the chosen distribution. The distribution to which the data is fitted can be either Normal or Log-normal. |
|
Degrees of freedom (DF) |
Degrees of freedom can be defined as the number of observations in a sample, minus the number of parameters measured from the sample (Davies 1974). What this means in practical terms, is that every time a parameter such as the mean of a sample of data is used in a calculation of another value (such as the standard deviation) the number of degrees of freedom will decrease by 1. |
|
P |
The P Value is a measure of the probability that the calculated test statistic is in error. |
|
RMS |
The RMS is a measure of “goodness of fit”. It is an intuitive measure; the smaller the RMS value the better the fit between the distribution of the sample data and the test distribution. |
Write
Click the Write button to write the raw data values (in a sample) plus the additive constant to the variable in the file defined by the 3 P Ln output field in the Analysis tab of the Histogram form. See: Three Parameter Log
The way in which values less than the graph minimum and values greater than the graph maximum are handled, is determined by selecting the check boxes associated with the 3 P Ln output prompt.