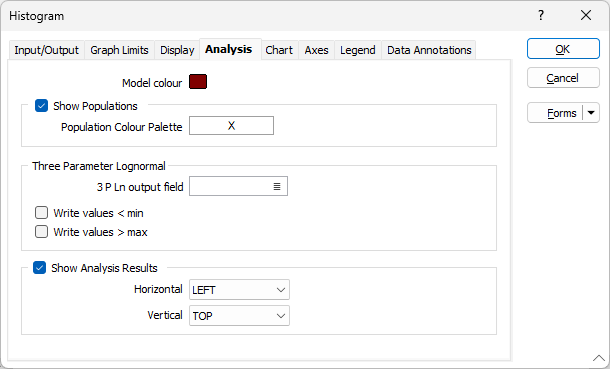
Analysis
Set the parameters on the Analysis tab of the Histogram form, if:
- You want to decompose the data into its constituent populations in the display
- You want to calculate a 3 parameter Log-normal fit for log-normally distributed data in the display
Using the prompts in this form, you can control whether or not the different populations of a data set will be shown. If you choose to show populations, you can define the colour used to for each population.
Model colour
Select a display colour for the 3 parameter log-normal curve (only available if the data is transformed to Natural Log, or if a composite curve defining mixed normal or log-normal populations is shown).
Show Populations
The Histogram function allows you to decompose data drawn from mixed populations into its component populations. Select this check box if you intend to show graphs representing each of the decomposed populations.
This is done by selecting Decompose from the Chart toolbar after the chart has been drawn.
![]()
The graphs representing each of the populations will be shown as dashed lines. If this information is shown on a probability plot the graphs of the individual populations may appear to be at a considerable distance from the graph of the data. This is not necessarily incorrect. The measure of how well the decomposed data fits the original data is not the position of the constituent populations on the chart, it is the shape of the model data. Measures of the goodness of fit are given by the Chi square value and the associated degrees of freedom and P values.
Populations Palette
Double-click on the Populations Palette box to choose a palette to apply to the component populations. You can also right-click on the box to see a preview of the current palette.
Three Parameter Log
The Three Parameter Log parameters are enabled when the Scale option on the Input tab of the Scale form has been set to NATURAL LOG (Ln).
![]()
3 P Ln output field
To further transform Ln (Natural Log) data into a data set which fits a 3 parameter Log-normal model by calculating an additive constant, you can write the corrected values i.e. the original value plus the additive constant back to a field in the original file.
Enter (or click on the List icon to select) the name of a field to which the raw data plus the additive constant will be written. If the field name does not exist in the file it will be created.
Write values < minimum
Select this check box if you have set the graph minimum very close to 0 and want to correct for raw data values which have a value of 0.
When not selected, only those raw data values greater than the graph minimum will be added to the additive constant and written to the 3 P Ln output field. Values below the graph minimum will be ignored by the calculation and the results field will be left blank for those records.
This option is only enabled if the 3 P Ln output field is defined.
Write values > maximum
Select this check box if you have set the graph maximum very close to the maximum raw data values and want to correct for raw data values which have a value up to the real maximum of the data.
When not selected, only those raw data values which are less than the graph maximum will be added to the additive constant and written to the 3 P Ln output field. Values above the graph maximum will be ignored by the calculation and the results field will be left blank for those records.
This option is only available if the 3 P Ln output field is defined.
The range of data values defined by the graph minimum and graph maximum are the values used in the 3 Parameter calculation. If this data set has a distribution significantly different from the distribution of the full data set, it may not be appropriate to select this check box.