Variograms
![]()
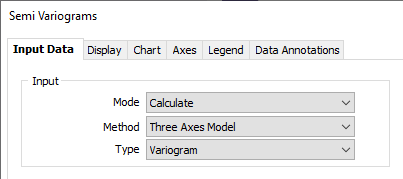
Input Data
Mode
On the Input Data tab of the Semi Variograms form, the selection of an Input Mode allows you to work with pre-processed data; the first run will use Calculate from raw data, but if a variogram file has already been written, subsequent runs may use an existing file as input.
| Mode | Description |
|---|---|
| Calculate | This option allows the semi variogram to be created from a set of raw data such as an Interval file, with coordinates for each of the data points in the file. |
| If the file contains 3D coordinates and the RL (elevation) coordinate is defined, 3D semi variograms are created when the semi variogram type is set to Omnidirectional or Directional. | |
| Enter the names of the Easting, Northing, and RL fields and define the direction for which semi variograms will be calculated. Optionally enter a name for the output file and run the process. | |
| If you select the Show semi variograms check box option, you can analyse and model the semi variogram display. Once a suitable model has been fitted to the semi variogram, you can save the model parameters for use in Cross Validation and Kriging. | |
| Display Existing | This mode allows previously generated semi variograms, which have been saved to file, to be re-displayed. Specify a file containing the semi variogram data as the input file, then click OK to run the function. |
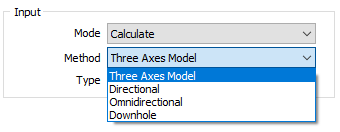
Method
Input method options allow you to switch between a Three Axes Model, Directional, Omnidirectional and Downhole variograms.
| Direction | Description |
|---|---|
| Three Axes | The degree of spatial continuity in a dataset is measured along three orthogonal axes. Theoretical variograms are then projected in additional directions. |
| Directional | Directional semi variograms (the default type) are used to measure the degree of spatial continuity in a particular direction through a data set. |
| The Directions dialog uses a variable-length list, allowing you to create any number of experimental variograms. Calculate and Replicate right-click options make it easy to fill the grid with numerical values. This also applies to colours; simply right-click and choose an option to auto-fill the column. | |
| Omnidirectional | Omnidirectional semi variograms are used for investigating the degree of spatial continuity in a dataset by searching for data pairs in all directions through the dataset. |
| Downhole | Downhole semi variograms are useful for the investigation of nugget values to be used when modelling directional semi variograms. |
Input Type
Select an input type:
| Type | Description |
|---|---|
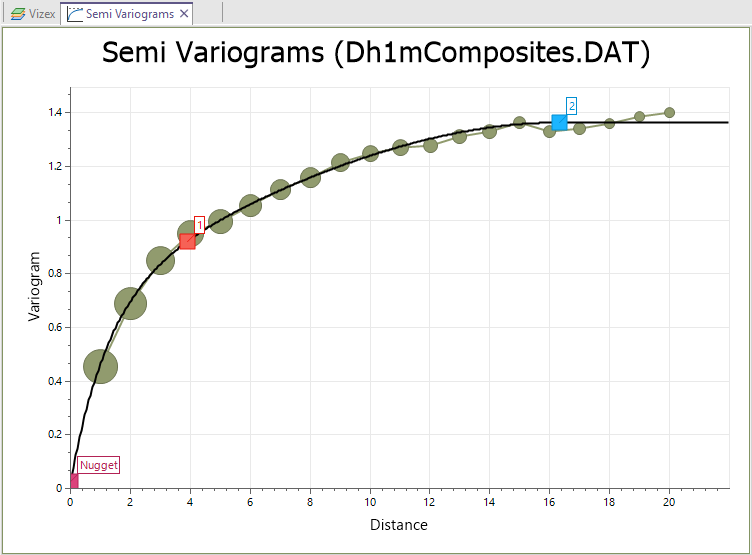
| Variogram | A semi variogram (often abbreviated to variogram) is a graph of the average value differences (and thus the correlation) between sample pairs at different distances. |
| Correlogram | Displays the inverse of the spatial correlation of the lagged data. |
| Relative Variogram | Scales the variogram by a function of the lag mean. |
| Pair-Wise Relative Variogram | A Pair-wise relative semi variogram may be used to model data that exhibits clustering and a strong positive skew. It reduces the influence of high values in the computation of the variogram, improving the interpretability of the graph. |
| Covariance | Displays the spatial covariance of the lagged data. |
| Madogram | (First Order Variogram): Displays the absolute values of the lagged data. |
| Rodogram | (Half order variogram): Displays the square roots of the lagged data. |
| Square Root Variogram over Madogram | Displays the square root of the Variogram over the Madogram. This is useful for validating a Gaussian Anamorphosis. |
Note: The smoothness of the Madogram and Rodogram make them useful for determining the range and anisotropy of noisy data. Do not use them for interpolation.
Raw Data
If you have chosen Calculate as the input mode, specify the name of the file and the fields that contain the raw data:
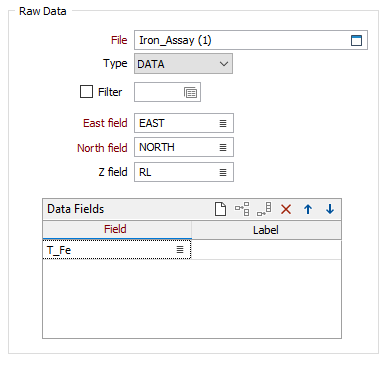
File
Select a file type and then double-click (or click on the select icon) to select the name and type of the File containing the raw data and specify the field from which the semi variogram will be calculated.
Filter
Select the Filter check box if you want to apply a filter to the data in the file. Enter a filter number in the adjacent response. Double click (F3) to see a list of existing filters. Right click (F4) to open the dialog box to create a new filter or edit an existing filter.
Note: For Downhole variograms, the raw data must contain Hole, From, and To fields. Field prompts and defaults will therefore change when you switch between a Downhole input direction and an Omnidirectional or Directional input direction (which require Easting, Northing, and RL coordinates).
Data fields
Select the fields in the input file on which the semi variograms will be based. Optionally, specify a label for each field. Use the buttons on the grid list toolbar to Manage the rows in the list.
Search Definition
The Search Definition group will change according to the (Three Axes, Directional, Omnidirectional, Downhole) input method you have chosen.
Show variance
Select the Show variance option to draw a horizontal line that shows the variance of the data set as a line across the semi variogram display. In many cases the data set variance will be very close to the final sill of a semi variogram model and therefore it can aid in the location of the final sill.
Semi Variogram Directions
The text of this button will change depending on the input direction of the variogram.
- Three Axes Model is the default type. Click the Directional Semi Variograms button to define the direction, plunge, tolerance, identifier, and display parameters for the three axes and any additional directions.
- Directional. Click the Directional Semi Variograms button to define the direction, plunge, tolerance, identifier, and display parameters of the variogram search.
- Click the Omnidirection & Downhole Semi Variograms button to generate and display semi variograms in a single pass.
Semi Variograms
There are two output options:
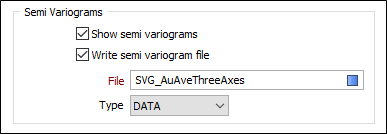
Show semi variograms
When the Input mode is Calculate, you will normally select this option in order to analyse and model the variogram. The semi variogram display will open when you run the function.
Write semi variogram file
When the Input mode is Calculate, select this option to output the parameters used to draw the semi variogram to a file. This will allow you to re-run the variograms without reprocessing the data. It also provides a way to display relative variograms.
File
When the Input mode is Display existing, the File prompt is enabled. If the Input type is Variogram, enter the name and type of the file containing semi variogram data. If the Input type is Pair-Wise Relative Variogram, enter the name and type of the file containing pairwise relative semi variogram data.
Data Values
When the Input mode is Calculate, use the Data Values group to apply a data transformation. Aside from not altering the data at all, the most commonly used transformations are NATURAL LOG and INDICATOR. See: Transformation
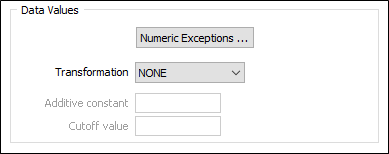
Numeric Exceptions
(Optionally) Use the Numeric Exceptions group to control the way that non-numeric values are handled. Non-numeric values include characters, blanks, and values preceded by a less than sign (<).
If the input mode is Calculate, specify the required data values:
Transformation
If you need to transform the data in the analysis field before the calculation, choose the appropriate Transformation (e.g. NATURAL LOG) and enter the related parameters.
Additive constant
This input will be enabled if you have set Transformation to NATURAL LOG.
An additive constant can be used with a natural log transformation to force data which is near log normal to take on a log normal distribution. Since the additive constant is added to all values, it has the effect of increasing the Natural log of small values relatively more than large values; in effect rotating the graph of the natural logs of the data value to the right.
Cutoff value
This input will be enabled if you have set Transformation to INDICATOR. Enter the value of the indicator to be used when using an Indicator transformation.
Import
The Import button at the right of the Semi Variograms form enables you to automatically populate the form based on a variogram control file (.mmvarx) created in Variogram Map.
To import a variogram control file, click Import and select the file. This will:
-
Clear any options already configured in the form
-
Set the Direction drop down to Directional
-
Set the Variogram to the type listed in the file
-
Setup the variogram control file in the Semi Variogram Directions... dialog, as input and output
-
Use the input file information to populate the corresponding input and transform fields.
Forms
Click the Forms button to select and open a saved form set, or if a form set has been loaded, save the current form set.
By design, the Forms button is not available for loaded Vizex layers (i.e. when opening the form set properties of a layer in the Vizex Layer Display pane). In Vizex, the Forms button is only available for new forms opened via the Home tab or the Vizex tab, in the Layers group (or by double-clicking on a form type node in the Vizex Layer Types pane).
Save and Save As
Click the Save button to save the changes you have made to the form set. Click Save As to save your changes as a new form set. Save As will default to the first available form set number.
Reset
Click Clear to clear the form of all values and reset the form to its default state. In the case of tabbed forms, set the first tab as the active tab.
Undo and Redo
Click Undo (CTRL + Z) to undo recent changes in the form. After an Undo, click Redo (CTRL + Y) to restore the last change that was undone.
Collapse
Collapse (roll-up) the form to preview a chart, or preview the results of an operation in Vizex, or obtain input values from Vizex, the Property Window, the File Editor, or the Plot Editor.
OK
Click OK to run the semi variogram calculation.
You can use the Previous and Next buttons to view each variogram separately (when they are being shown in sequence).
The state of the Show Together button will determine whether variograms are shown together or shown singly, in the chart and in the Properties window.
You can use the Show Control File button in the Variograms group on the ribbon to display the control file in the Viewer.
