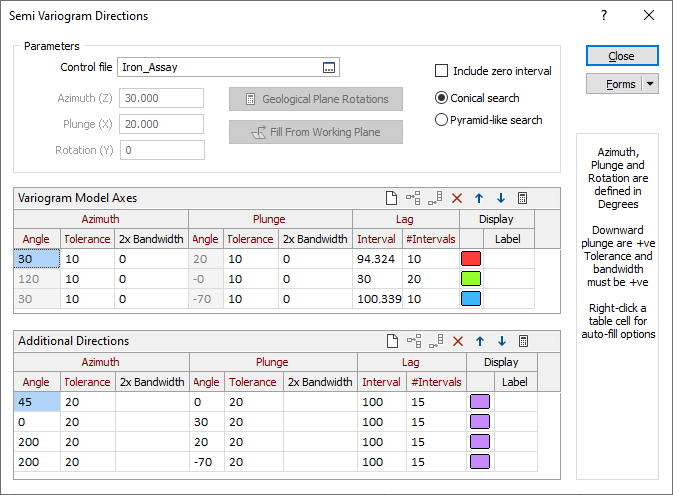
Three Axes Model
When you select Three Axes Model as the Input method, the degree of spatial continuity in a dataset is measured along three orthogonal axes. Theoretical variograms are then projected in additional directions.
Calculate and Replicate options on the right-click menu make it easy to fill the grid with numerical values.
Parameters
Control file
Optionally, enter or double-click (or click on the ellipsis to select) the name of a Variogram Control (*.mmvarx) File containing the parameters you want to use. If you have specified a new file, the parameters you enter or modify in the form will be written to this file.
A Variogram Control File can be saved on the Chart | Variograms tab once a Variogram Map or Variograms Chart has been calculated, and provides a way of passing variogram information between different Variography functions or any function that need to reference a semi variogram as part of its modelling parameters.
Include zero interval
In some cases it may be useful to include the zero lag interval in the semi-variogram calculation. If this option is selected, pairs of samples in the zero interval lag are used to calculate the gamma value of the first point in the semi-variogram.
For example, let's take lag distance 70 m. Because the default setting for the lag tolerance is half the lag distance, the first lag interval is from 35 to 105 m, second is from 105 to 175 m and so on. In this case "zero interval" is from 0 to 35 m.
Azimuth, Plunge and Rotation
Set the Azimuth, Plunge and Rotation of the three axes using the following tools:
Geological Plane Rotations
Click this button to view or edit the parameters used to set the orientation of a geological plane and apply it to your variograms. See: Geological Plane Rotations
Fill From Working Plane
This button can be used to quickly set the orientation of your variograms to match the current Vizex Working Plane (the button is disabled if there is no working plane defined). See Align View to Working Plane
Direction Tolerance
Choose whether a Conical or a Pyramid-like volume will be used to search for the data to be used in the semi variogram calculations. The Direction Tolerance is defined by this setting and the tolerance settings for the Azimuth and Plunge of a search direction.
Variogram Model Axes
Define the characteristics of a directional search for the Three Axes plus Additional Directions:
Azimuth
Azimuth Angle
For each azimuth, the plunge, interval length and number of intervals must be defined. The azimuth must be a value between 0 and 360°. Only whole degrees can be entered. Angles are measured clockwise from North.
Azimuth Tolerance
You must also specify a tolerance for the azimuth. The tolerance will be added to and subtracted from the azimuth you specify. Data that falls within the volume defined by the tolerance will be included in the calculation. Entries with up to one decimal place can be entered.
Azimuth 2x Bandwidth
This field is used to define a distance in metres which is the maximum width of the cone or prism, as defined by the tolerance setting that is applied to the azimuth of a search direction.
Plunge
Plunge Angle
Enter the plunge for which a calculation will be made. In this case downward values are positive (+Plunge = Down). The plunge must be measured from the horizontal (0) in the plane of the azimuth. Only whole degrees can be entered.
If a Z field is not defined then the Plunge, Plunge Tolerance and Bandwith options are disabled.
Plunge Tolerance
You must also specify a tolerance for the plunge angle. The tolerance will be added to and subtracted from the plunge you specify. Data that falls within the volume defined by the tolerance will be included in the calculation. Entries can have up to one decimal place.
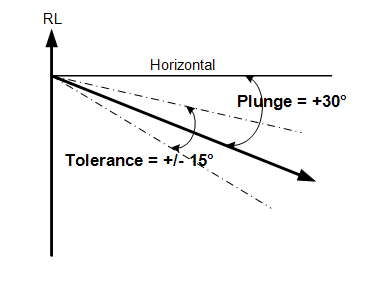
In this case, plunge values are positive down and the horizontal = 0. Leave the plunge at 0 when two dimensional calculations are being performed, that is, a Z variable has not been specified.
Plunge 2x Bandwidth
This field is used to define a distance in metres which is the maximum width of the cone or prism, as defined by the tolerance setting applied to the plunge of a search direction
When 2D semi variograms are specified (by not defining a Z field in the Semi Variograms form) the Plunge group will be disabled.
Lag
Interval and Number of Intervals
You need to define the interval size and the number of intervals to control which values the semi-variogram calculation will use. In geostatistics the Interval is called a Lag.
Directional and omnidirectional semi variograms group samples into distance intervals. Pairs of samples at distances equal to the product of the interval number and the interval, plus or minus half the interval size, are included in the calculation for a search volume.
The maximum distance covered in the search for values is the product of the Interval size and the number of Intervals. Generally, this distance is approximately half of the sample coordinate range for a particular direction.
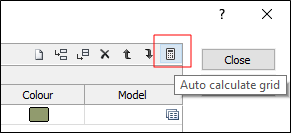
![]() An auto-calculate button can be used to calculate appropriate Interval and Number of Intervals parameter values.
An auto-calculate button can be used to calculate appropriate Interval and Number of Intervals parameter values.
Display
Display mode
Once you have entered the azimuth and plunge for each search direction, you need to define how they will be displayed. Alternatively, you may choose not to select a display mode when you want to switch a direction off temporarily to simplify the display.
One or more of the following options may be selected to control the way the graph of each semi-variogram is displayed:
- Line The Line display option displays a simple line graph. The corresponding marker symbol will appear at each interval distance. Its size will vary proportionally to the number of pairs in that interval.
- Scale The Scale display option displays a scaled symbol. The interval semi-variogram value for the azimuth is scaled relative to the number of pairs in the interval.
- Pairs The Pairs display option displays a fixed size symbol with the number of pairs written beside the symbol.
- Bars If selected, the Bars option will display bars, which represent the number of pairs within each bin, below the main graph.
- Bar Pairs If selected, the Bar Pairs option will label the number of pairs within each bin, below the main graph. This option may be selected independently of the Bars option.
Marker
Select a marker symbol for each semi variogram. A range of standard (Circle, Square, Diamond, Pentagon, Hexagon, Star, Triangle, Plus, Cross) marker symbols are available for selection in a drop-down list.
Colour
For each semi variogram, double click on the Colour button (or press F3) to display a colour palette to select from.
Model
To summarise the final model, it is often useful to display the raw data alongside the experimental semi variograms. Double-click on the form set icons to select a Model that most closely resembles the experimental semi variogram you have created. Once you have done that, you can refine the characteristics of the model by changing its coefficients. See: Semi Variogram Model
Once satisfied with a match you can save the model coefficients as another form set.
Label
Optionally, specify a label for each semi variogram. You can use the Show direction labels check box, on the Display tab of the Semi Variograms form, to show or hide the labels.
Forms
Click the Forms button to save the directions you have defined for the semi variogram search as a form set. Conversely, you can populate the parameters of the form using a saved form set.
New
Click the New button to empty the current set of values displayed in the Three Axes Model form.
Close
Click Close to return to the Variograms form.