Working with Downhole Images
Downhole survey measurements provide a way of determining the path of the drillhole in 3D space. Essentially, this is done by measuring the direction and inclination of the hole at regular depth intervals. The direction is measured as the angle clockwise from the north axis (north = 0°), while the inclination measures the deviation from the horizontal (where -90° is "vertically down").
Downhole images may be obtained from any image source, such as 360° core scanners and downhole optical/acoustic imaging systems. Any source that maintains a constant scale, can be depth referenced, and shows the full core cylinder is suitable. Images acquired using downhole methods (which capture the inside of the drillhole) must be mirrored so that they resemble the “core” as viewed from the outside.
For information on executing a Depth Adjustment process, see Depth Adjustment.
The following sections contain information on working with downhole images in Micromine Geobank.
Basic Navigation
Various methods can be used to navigate the depth adjustment details.
-
Scroll bar
Use the scroll bar at the right-side edge of the form to change the current viewing position down the hole.-
Drag the scroll bar or click above / below to display the equal range above/ below the currently visible range.
-
Click the Up or Down arrows in the scroll bar to produce the same behaviour as the mouse wheel.
-
-
Keyboard
Use the Up and Down keys to scroll exactly one tick mark up or down the depth adjustment window. The Page Up and Page Down keys also produce the same result.
-
Mouse wheel
The mouse wheel up and down pans the view a distance of exactly one scale label or annotation. Note: Scale bar labels will be displayed at a reduced frequency when panning.
-
Toolbar
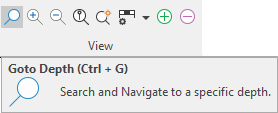
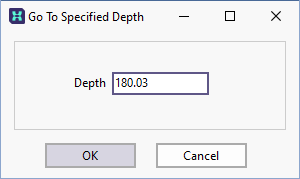
Click the Go to depth button on the toolbar to move to a specified depth in the drillhole.
Alternatively, click on any panel and select the Data tab to view the dataset associated with that panel.
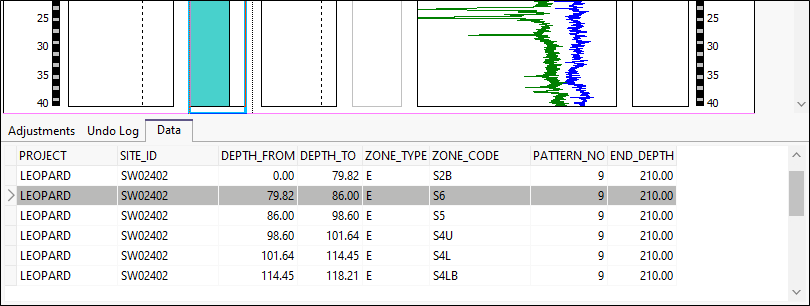
You can navigate to any point within the dataset (keeping in mind that the dataset will not reflect changes that have not been saved to the database).
Changing the Display Area
Use the Zoom In button option to enlarge a specified depth range. Select the zoom tool on the toolbar, then click-and-drag on the image to outline the area of interest. The selected depth range will be expanded to fit the viewing area.
Click the Zoom Out button to restore the original view.
Click the "Fit To Page button to fit the entire length of the drillhole in the viewing window. This action will automatically turn off annotation to avoid clutter.
You can turn the annotation on or off at any time by using the annotation toggle on the toolbar.

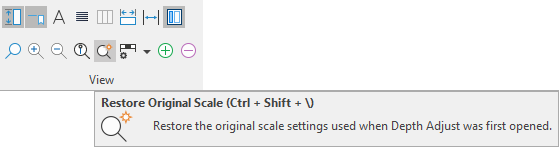
To restore the original view, click the Original Scale button , or click the Zoom Out button.
Zoom and Scale
|
|
Use the Zoom option to enlarge a specified depth range. Select the zoom tool on the toolbar, then click-and-drag on the image to outline the area of interest. The selected depth range will be expanded to fit the viewing area. Click the Zoom Out button to restore the original view. |

|
Click the Fit To Page button to fit the entire length of the drillhole in the viewing window. This action will automatically turn off annotation to avoid clutter. (See "Annotation button" below). |

|
Click the Original Scale button to restore the page to its original scale. |


Image Viewer
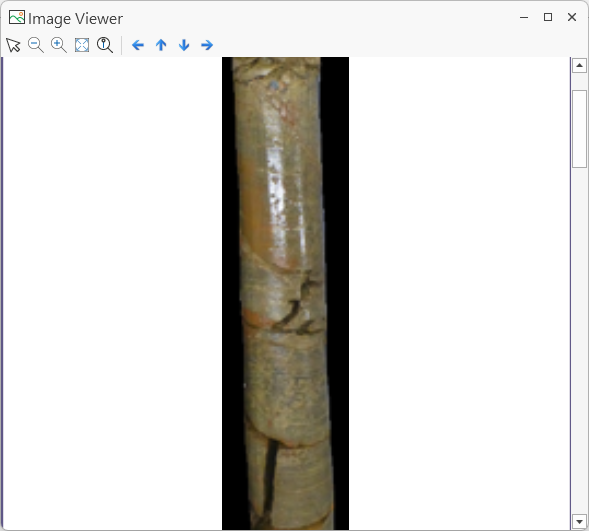
The Image Viewer can be helpful when using Depth Adjust to see detail in imagery, particularly if you use a high-resolution monitor. The Image Viewer is particularly useful for:
-
reading markers or text on images and
-
identifying features in images.
To review an interval image, you can select the Show in Image Viewer option:
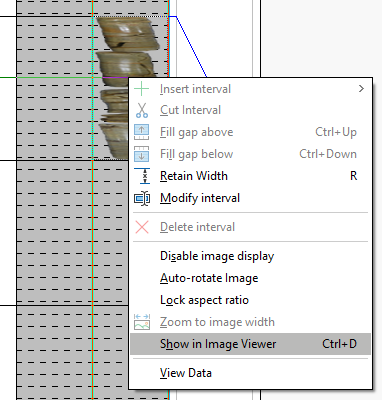
The selected image will be opened in the Image Viewer and can be zoomed and panned using the available tools:

|
Use the Select option to drag the image up - down (or left - right if applicable) inside the viewer. |
|
|
Use the Zoom option to enlarge the view of a selected region of the image. Select the zoom tool on the toolbar, then click on the image on an area to be zoomed in. Each click on the image will zoom one more level IN to the selected area. Click the Zoom Out button and click in the image the required number of times to zoom back out to a required view. |

|
Click the Fit to Screen (Ctrl +B) button to fit the entire length of the image in the Image Viewer. The image will be displayed in whole, without need for scroll bars, no matter the current size of the Image Viewer window. |
|
|
Click the Zoom to Actual Size button to display the image at 100% scale within the Image Viewer. |

|
Use the Pan Left arrow to pan the image view, one grid unit per click to the left. |

|
The Pan Up arrow will pan the image in the viewer up one grid unit per click. |

|
The Pan Down arrow will pan the image in the viewer down one grid unit per click. |

|
Click the Pan Right arrow to pan the image view, one grid unit per click to the right. |
Windows built-in Magnifier
The Windows built-in Magnifiercan optionally be used to see detail in the Depth Adjustment chart, as well as imagery, as an alternative to the Image Viewer. The magnifier can be especially of use for accurately positioning the cursor in non-image overlays.
Recommended Usage
| Shortcut/Setting | Description |
| Windows key + Esc | Exits the Magnifier. |
| Windows key + the Plus key | Opens Windows magnifier (using last-used settings) / Increases the zoom (when magnifier is already open) (200%-400% recommended). |
| Windows key + the Minus key | Decreases the magnifier window zoom. |
| Ctrl + Alt + D | Switched to Docked mode - resize to a narrow tall window positioned so as not to obscure any panels you are working with. |
| Ctrl + Alt + I | Invert Colours - the inverse contrast ("photographic negative") may assist with reading markers or spotting features. |

Checking depth alignments
To toggle the display of static horizontal line across the width of the drawing canvas for the purpose of checking depth alignments, click the Show Depth Grid button.

Changing the vertical scale bar properties
Select an option from the Scale Bar Settings tool menu option, or right-click on the scale bar and select an option from the right-click menu.
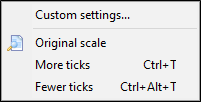
Use Fewer Ticks and More Ticks to decrease or increase the ticks interval respectively. The annotation interval will be adjusted automatically. This can also be achieved using the More Ticks and Less Ticks buttons on the toolbar.
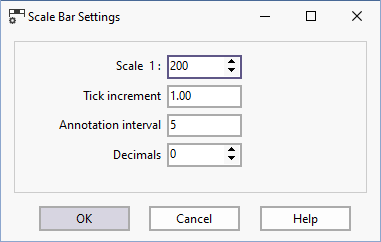
Select the Custom Settings option to change the properties of the vertical scale bar.
 .
.
After changing the scale bar settings you can revert to the original properties by selecting the Original Scale menu option.
For more information, refer to the following topic links: