Depth Adjustment
Depth Adjustment processes are configured and added to a user profile. To execute a depth adjustment process, either double-click on the Depth Adjustment based on Geophysics object, or select the object and click Execute from the Ribbon or right-click menu.

The Substitution Parameters form opens.

Select a Project and a Drillhole for the depth adjustment from the Parameter fields provided and click OK.
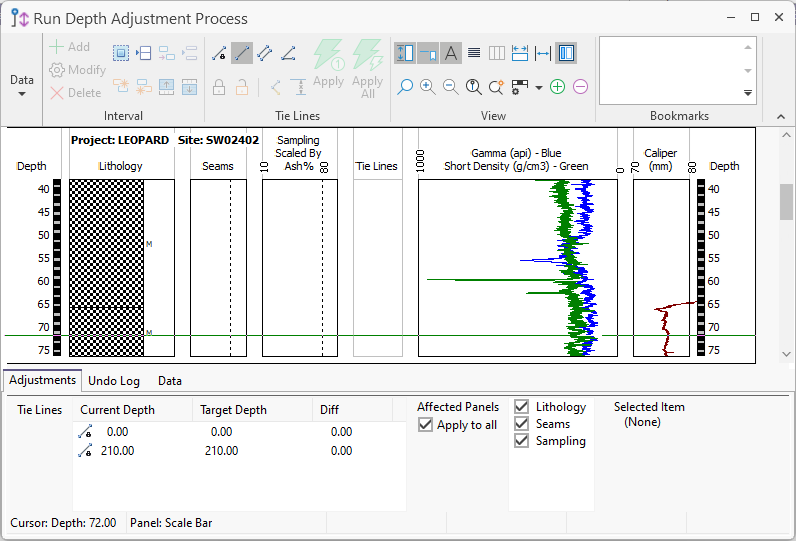
The Depth Adjustment form displays several panels side by side on the drawing canvas. Each panel contains a graphical representation of appropriate downhole data, such as geophysical data, a lithological log, sampling details, geotechnical data, etc.
Panels are divided into source panels which are adjustable, and target panels, which are reference panels that cannot be adjusted.
Some panels (e.g. downhole geophysics) are used only as target (reference) panels. These panels provide information that can be used as a basis for the definition of the depth control points. Based on this information, depth intervals in one or more adjustable source panels can be modified to match the target depths.
Depth adjustments are traditionally performed against geophysical data. However, Micromine Geobank allows you to use any type of data as a reference dataset.
Control points are represented by tie lines. A tie line is created by clicking on a downhole position in one of the adjustable panels and then dragging the mouse to link this point to a corresponding target depth in one of the reference panels. The resulting tie line is displayed in the tie line column, which separates the adjustable panels from the reference panels. By default, the adjustable panels are shown on the left, with the reference panels on the right.
The details for individual tie lines are displayed in a list view at the bottom of the window.
The main form has a menu bar, toolbar and a number of right-click context menus that control the functions provided by the depth adjustment tool.
Basic Navigation
Various methods can be used to navigate the depth adjustment details.
-
Scroll bar
Use the scroll bar at the right-side edge of the form to change the current viewing position down the hole.-
Drag the scroll bar or click above / below to display the equal range above/ below the currently visible range.
-
Click the Up or Down arrows in the scroll bar to produce the same behaviour as the mouse wheel.
-
-
Keyboard
Use the Up and Down keys to scroll exactly one tick mark up or down the depth adjustment window. The Page Up and Page Down keys also produce the same result.
-
Mouse wheel
The mouse wheel up and down pans the view a distance of exactly one scale label or annotation. Note: Scale bar labels will be displayed at a reduced frequency when panning.
-
Toolbar
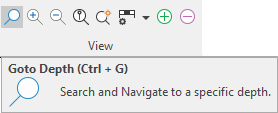
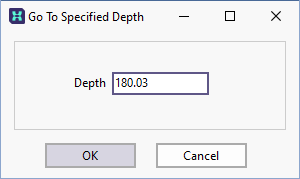
Click the Go to depth button on the toolbar to move to a specified depth in the drillhole.
Alternatively, click on any panel and select the Data tab to view the dataset associated with that panel.
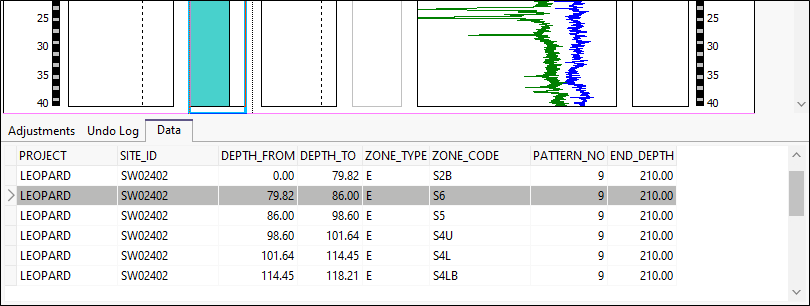
You can navigate to any point within the dataset (keeping in mind that the dataset will not reflect changes that have not been saved to the database).
Changing the Display Area
Use the Zoom In button option to enlarge a specified depth range. Select the zoom tool on the toolbar, then click-and-drag on the image to outline the area of interest. The selected depth range will be expanded to fit the viewing area.
Click the Zoom Out button to restore the original view.
Click the "Fit To Page button to fit the entire length of the drillhole in the viewing window. This action will automatically turn off annotation to avoid clutter.
You can turn the annotation on or off at any time by using the annotation toggle on the toolbar.

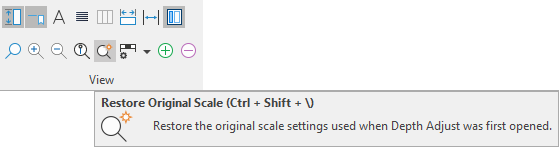
To restore the original view, click the Original Scale button , or click the Zoom Out button.
Checking depth alignments
To toggle the display of static horizontal line across the width of the drawing canvas for the purpose of checking depth alignments, click the Show Depth Grid button.

Changing the vertical scale bar properties
Select an option from the Scale Bar Settings tool menu option, or right-click on the scale bar and select an option from the right-click menu.
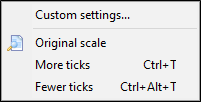
Use Fewer Ticks and More Ticks to decrease or increase the ticks interval respectively. The annotation interval will be adjusted automatically. This can also be achieved using the More Ticks and Less Ticks buttons on the toolbar.
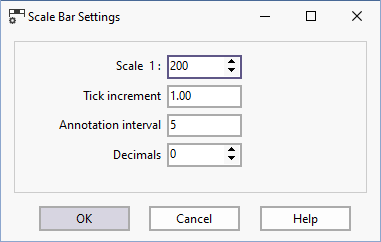
Select the Custom Settings option to change the properties of the vertical scale bar.
 .
.
After changing the scale bar settings you can revert to the original properties by selecting the Original Scale menu option.
For more information, refer to the following topic links: