Drillhole Collection Export
Drillhole Collection exports are used to export drillhole data to Nexus, Micromine's dedicated data storage platform.
To create a Drillhole collection, a Drillhole Dataset is required - see Drillhole Dataset.
When you create a Drillhole Collection for export, you specify the database tables and columns that include the drillhole data to be uploaded to your linked Nexus project. Data uploaded to Nexus can be viewed in the Visualiser, a similar tool to Vizex, Micromine Origin & Beyond's graphical interface. For information on viewing data in Nexus, see the Nexus Help online.
To create a Drillhole Collection for export to Nexus, in the Configuration Manager under Data Transfer,
-
Right-click on the Drillhole Collection option.
-
Select New | Drillhole Collection Export.

The Drillhole Collection Export window is opened and you can add a Name and Description for the new drillhole collection.
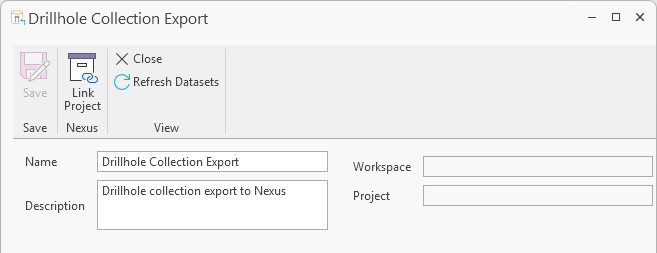
If a dataset is created after a collection is made, you can click the Refresh Datasets button in the toolbar to refresh the datasets visible to the object.
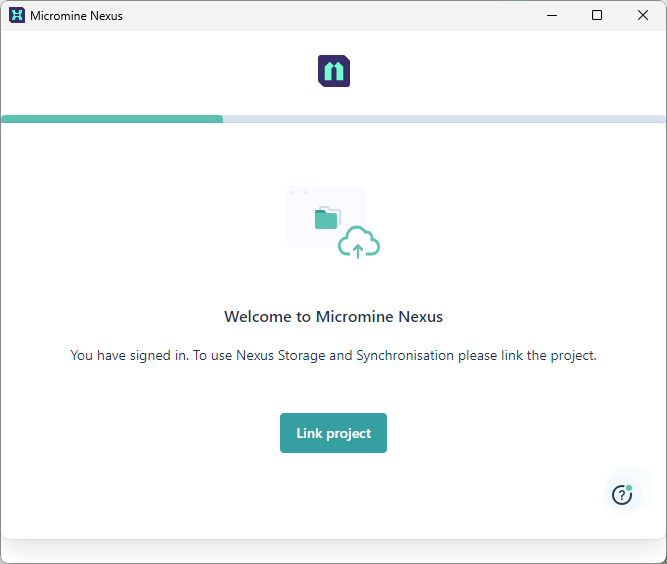
To configure the export, you can use the Link Project tool in the Drillhole Collection Export window to link to a Nexus project. If you are not signed in to Nexus, you will be required to. When completed, you can use the wizard to link your project:
-
Click Link Project to continue.
-
Select the Workspace which contains the Project to be linked and click Continue.
-
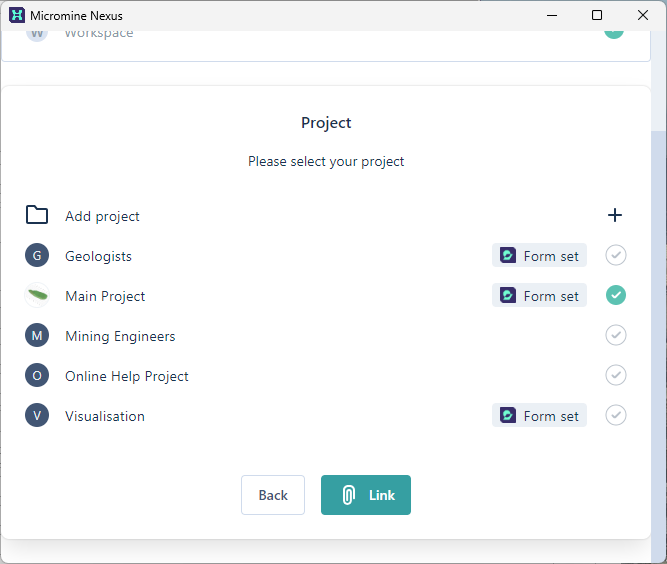
Select the Project to link the drillhole collection export to and,
-
Click Link:
This will add the Nexus Workspace and Project name to your Drillhole Collection Export details.
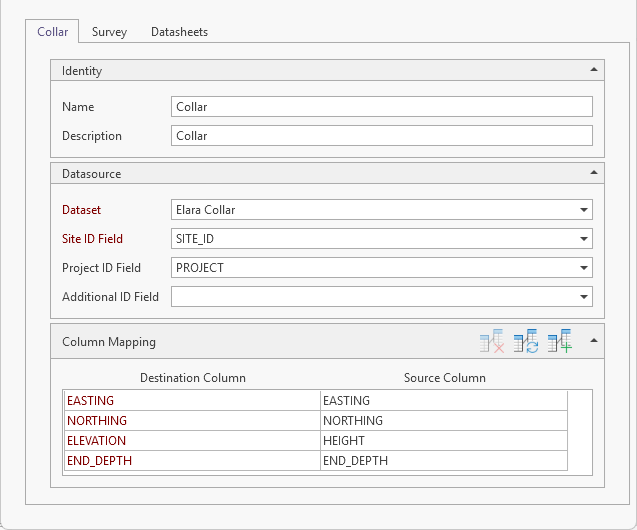
With these details configured, the Collar information can be filled using the Collar tab.
-
Enter a Name and Description for the Collar information in the Identity fields.
In the Datasource section of the Collar tab,
-
Select the Dataset for the drillhole collection export from the drop down list of the available Drillhole Dataset.
-
The Site ID Field option is automatically filled where found. If required, you can select a different field from the drop down list of the fields in the dataset.
-
The Project ID Field is also automatically filled and you can select a different field from the drop down list, if required.
-
Optionally select an Additional ID Field from the drop down list, if required.
Collar
The Collar tab of the Column Mapping section contains a grid displaying Destination columns and Source columns for mapping the Collar data for export.
The buttons in the Column Mapping header are defined in the following table:
|
Icon |
Description |
|---|---|
|
|
Delete all mappings |
|
|
The Automatically map matching columns Wizard automatically compares the data for matching of the Master dataset columns to the columns in a Child dataset. |
|
|
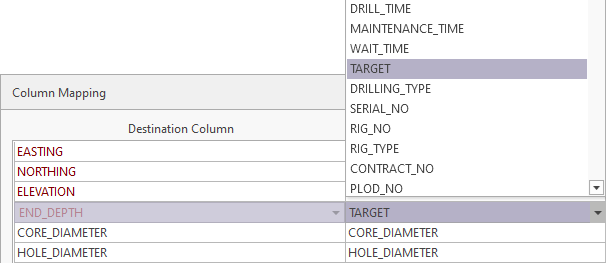
Add new mapping allows you to manually add a mapping for the source and destination columns for which there is not an exact match. Select the source and destination columns from the drop-down lists. Entries are placed at the bottom of the mappings list. |


You can click the Auto Map button in the grid header to automatically add mapped columns to the grid:
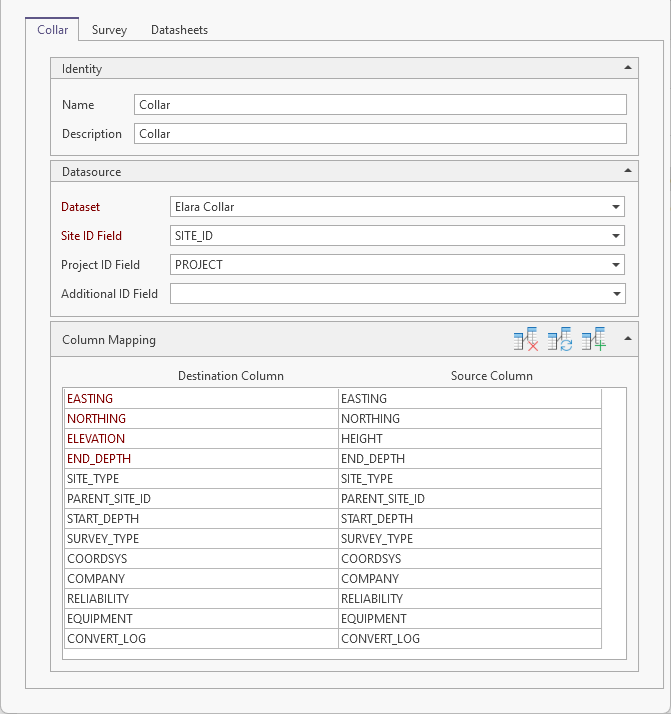
Compulsory fields will appear in the grid in Red and, if they cannot be filled automatically, they must be mapped manually using the Source Column fields.
Survey
When the Collar data has been properly mapped, click the Survey tab to map the Survey data tables:
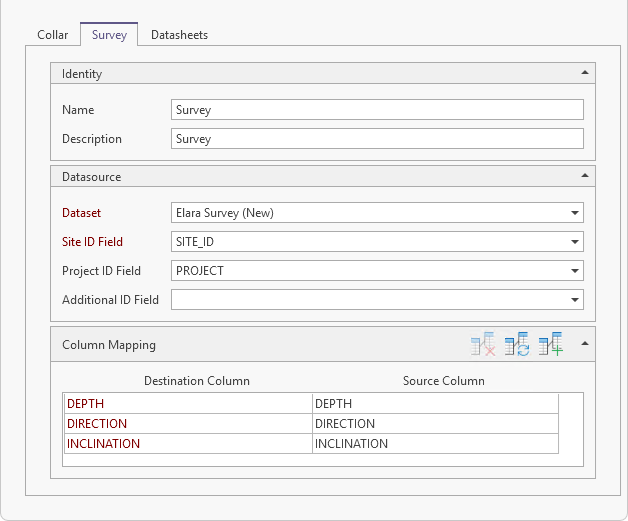
You can automatically map the columns in the grid using the method outlined previously. As with Collar data, the columns in Red for the Survey data are compulsory and must be manually mapped if they are not autofilled.
For information on the available buttons in the Column Mapping section, see the table above.
Datasheets
When the Survey data has been mapped in the grid, click the Datasheets tab.
Datasheets are created to represent the Event and/or Interval data for the drillhole collection export.
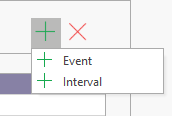
To add a datasheet, click the Add button in the Datasheets header and select Event or Interval:
Event
Events are created to denote points down drillholes (or along a trench) where something of interest has happened. For example, you may want to record the point where oxidation stops.
Selecting Event from the Datasheets Add button menu will add an Event row to the Datasheets grid. With the new Event selected, you can enter the Identity, Datasource and Column Mapping details for the event.
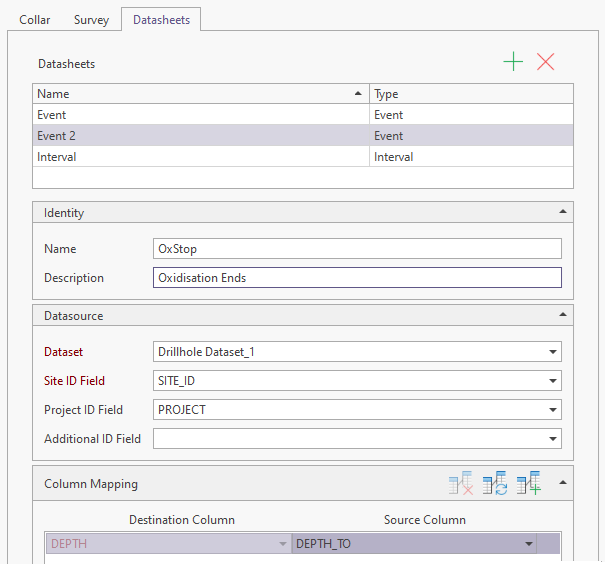
In the Identity section of the tab, enter a Name and Description for the new
The Datasource section is used to select the Drillhole Dataset and related ID fields for the
Use the drop down list to select the Dataset for the
Select the Site ID Field from the drop down list of the fields in the selected dataset.
Optionally, you can select a Project ID Field and/or Additional ID Field from the provided drop down lists.
In the Column Mapping section, you can automatically map the columns in the grid using the method outlined previously. As with previously configured drillhole data, the columns in Red are compulsory and must be manually mapped if they are not autofilled.
For information on the available buttons in the Column Mapping section, see the table above.
When the

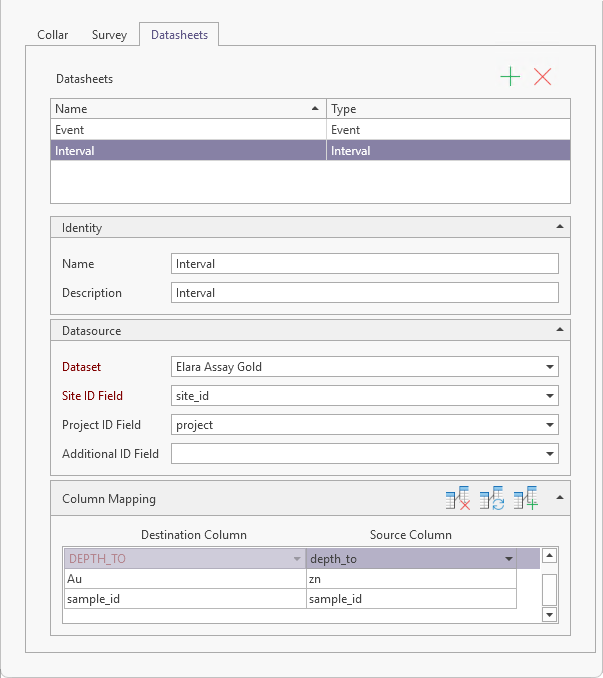
Interval
An Interval contains information such as assays or lithology for successive intervals down each drillhole (or along each trench).
Selecting Interval from the Datasheets Add button menu will add an Interval row to the Datasheets grid. With the new Interval selected, you can enter the Identity, Datasource and Column Mapping details for the interval.
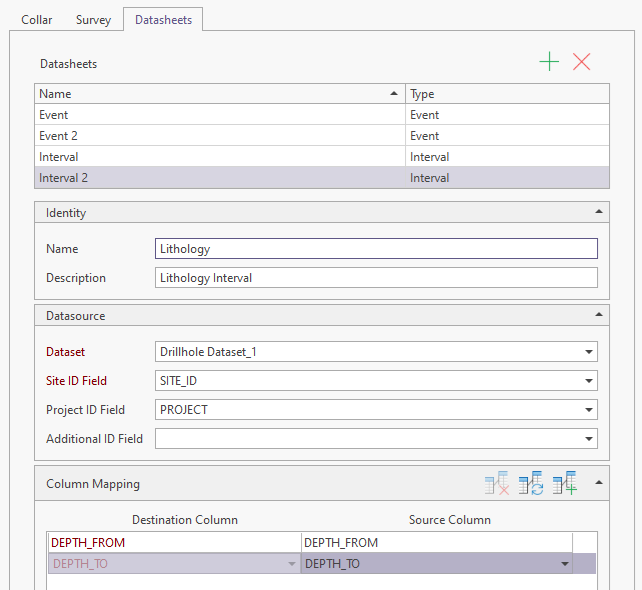
In the Identity section of the tab, enter a Name and Description for the new
The Datasource section is used to select the Drillhole Dataset and related ID fields for the
Use the drop down list to select the Dataset for the
Select the Site ID Field from the drop down list of the fields in the selected dataset.
Optionally, you can select a Project ID Field and/or Additional ID Field from the provided drop down lists.
In the Column Mapping section, you can automatically map the columns in the grid using the method outlined previously. As with previously configured drillhole data, the columns in Red are compulsory and must be manually mapped if they are not autofilled.
For information on the available buttons in the Column Mapping section, see the table above.
When the
The Datasets and Drillhole Collections you create will be listed in the Configuration Manager under Data Transfer | Drillhole Collection:
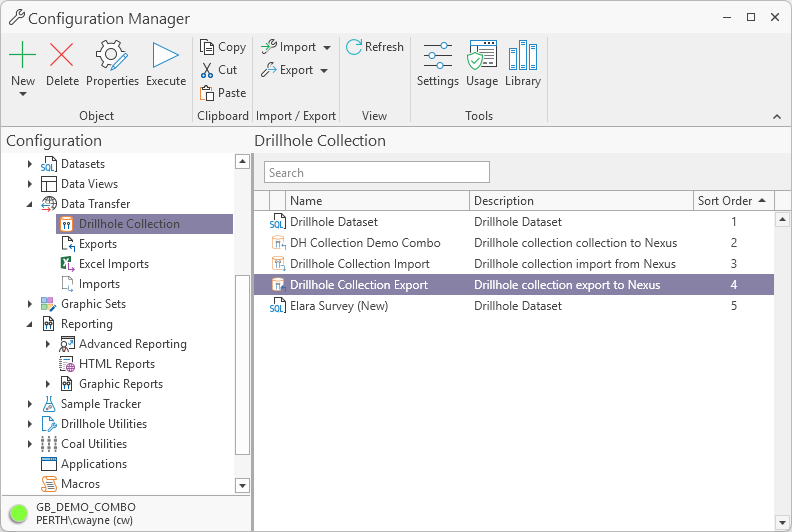
Individual Drillhole Collections can be published from here using the Execute command on the right-click menu. See: Execute: Drillhole Collection Export.
When you Publish the drillhole collection export to Nexus, any Interval data as configured for the datasheet will be included in the Drillhole object for viewing.
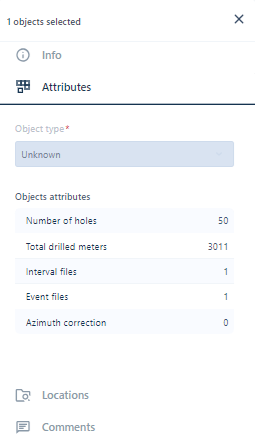
Data for both Events and Intervals configured in the datasheet/s will be displayed in Nexus in the Attributes for the drillhole collection: