Tools
The following tools are provided on the Plan View toolbar:
- Click the Print button to print the current view:
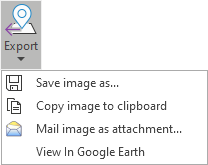
- Select an option from the Export tool menu. You can save the current view as an image, copy the image to the clipboard, mail the image as an attachment in an email, or save the image in a format that can be viewed in Google Earth
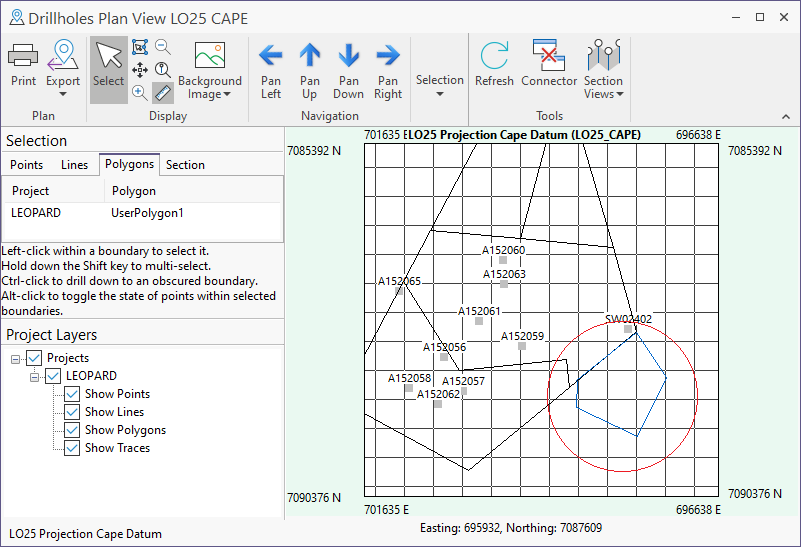
- When you use the Select tool to click on a drillhole, the coordinates for that point are shown in the status bar. When you click on a boundary, the extent of the boundary are displayed.


To select a polygon that is obscured by another boundary: Use Ctrl + Click to drill down to the next level.
As you move the cursor around the display with the mouse, the coordinates of the cursor position are constantly updated and shown in the status bar.
-
Click the Define Polygon tool to interactively define a boundary that can be used for site selection. The Show polygons check box must be selected in the Project layers tab.
Note that the user-defined boundaries you add are temporary, i.e. they are not saved to the database.

Click in the view to define successive boundary points:
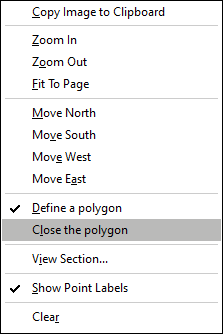
Double-click to close the polygon (or select Close the polygon from the right-click menu).
The polygons you have defined can be used to select or deselect points, by first selecting the polygons and then selecting the points within them.
Polygon Selection
- Left-click selects a boundary polygon
- CTRL + click selects a user-defined polygon or obscured boundary in the order created
- Include SHIFT key to select multiple polygons
Points in Polygon Selection
- Press ALT + click to toggle the selection of all the points inside the selected polygons (excluding the section points)
- Click the Pan tool to put the view into Pan mode:
- Click the Zoom in and Zoom out tools to zoom in/out on the current view.
- Click the Fit To Screen button to fit the entire length of the drillholes in the section view:
- Click the Show Grid button to toggle the grid on and off:

When the view is in Pan mode you can pan the view left and right, or up and down, by clicking and dragging the mouse. Alternatively, click on the Pan tools to move incrementally left, right, up or down.
CTRL + click + drag to retain the current pan behaviour????
 _
_ 

This action will automatically turn off annotation to avoid clutter. (See "Annotation button" above).

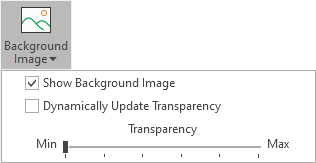
Select an option from the Background Image menu to display a georeferenced image from the configured Plan View Images Folder.
The Dynamically Update Transparency check box determines whether the transparency level for the georeferenced background image is dynamically updated as the Transparency slider is adjusted. With this option unchecked, the transparency level will take effect when the slider is stopped.
You can also set the Transparency level of the displayed image. The default transparency value may have been configured for the Plan View, but you can use the slider to change the current transparency level of the display.
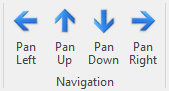
- Use the arrows in the Navigation section to Pan the grid for the Plan View display, one grid unit per click in the selected direction. Any included background image will also pan with the grid; ensuring the correct location of each point is retained in the display.
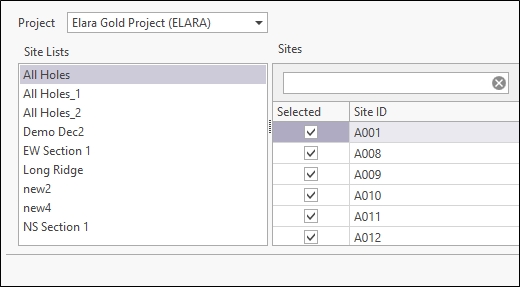
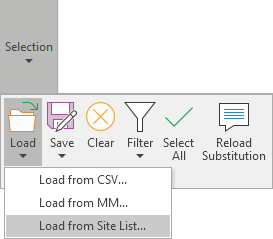
- Select an option from the Load menu to load data in CSV or Micromine format, or from a Site List:
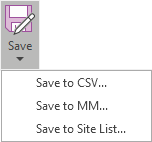
- Select an option from the Save menu to save the data in the view to CSV or Micromine format, or save it to a Site List:
- Click Clear to clear the current selection:
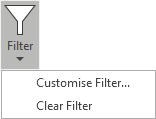
- Use the Filter menu to create a Custom Filter. Select Clear Filter to clear a filter that has previously been applied to the dataset. See: Filter Editor
- Click Select All to quickly select all of the holes in the plan view:
- Click Reload Substitution to reload substitution parameters from a plan view, or a correlation diagram. This allows you to quickly re-launch the view, or diagram, without having to close it first.
- Click the Refresh button to update the displayed drillholes with the latest completed data logged to Micromine Geobank For Field Teams.
- Click the Connectivity tool to use the Plan View to modify the selection of the holes in the Site List Editor or vice versa (the tool must be enabled in both) - or select a hole or a boundary that will then be queried (typically to create a downhole or a lease summary) in a Graphic Report:
- Use the Section Views tool menu to select a section to display. The sections available for selection are configured in the Configuration | Sections page of the Plan View Property Editor. See: Drillhole Section
For information on the display of georeferenced images, see Georeferenced Images
![]()

Note that this option will be disabled if the Plan View or Correlation Diagram is invoked from a macro and the Reuse Substitution Parameters in Macros check box is selected


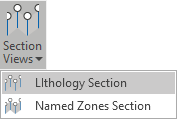
Note: The Section View drop-down will list all configured correlation diagrams, not just those assigned to the current profile.