Non-Spatial Guidance
The Setup > Scheduling > Non-Spatial Guidance step allows the importation of longer term plan or strategic plan data (target rates, tonnes, hours, etc) from an external data source.
Enabling Non-Spatial Guidance
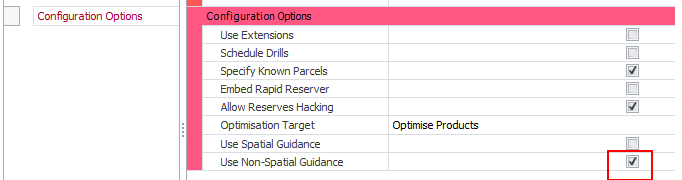
The Non-Spatial Guidance feature is optional and must be enabled or disabled via the Use Non-Spatial Guidance flag in the Configuration Options setup step. Note that this option is disabled by default.
When enabled, a new setup step Non-Spatial Guidance will appear in the Setup > Scheduler Task list.
The User Interface
The Non-Spatial Guidance user interface is broken down into 4 distinct areas:
, External mappings (top right), Data preview (bottom)")
Field Mappings (top left), External Fields (top right), Data Preview (bottom)
1. The Source area
-
Allows users to select/delete/refresh the Source file.
Note: The imported file must be aligned with data in columns and field names in a header row. One column must contain date information. The physical export file uses this layout and can be used to transfer data between models.
-
Provides information on when data was last imported.
-
Allows user to select what Date field to use to match to with Period dates in the model.
2. Field Mappings
-
Users can create/delete/move Internal fields.
-
User can import/export field mappings between models.
-
Internal Field – Name that will be used in ATS
-
External Field – Column name from the imported file. These fields can be dragged and dropped from the External Fields area.
-
Aggregation Type – Drop down to select how the data will be aggregated.
-
Sum – Data will be summed over the periods.
-
Weighted – Data will be weighted by the Weighting field.
-
-
Weighting Field – External field that will be used for weighting of the selected row.
Field Inputs
3. External Fields
-
A summary of all data columns in the Source file.
4. Data Preview
-
After all mapping has been completed or after changes have been made to the mapping, click the Preview button to refresh the table and display the data that will be imported.
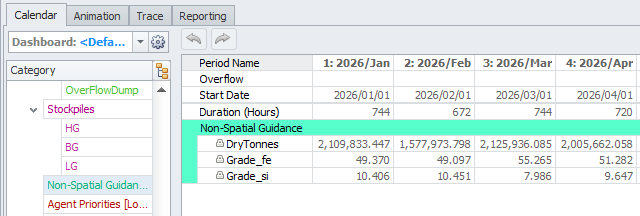
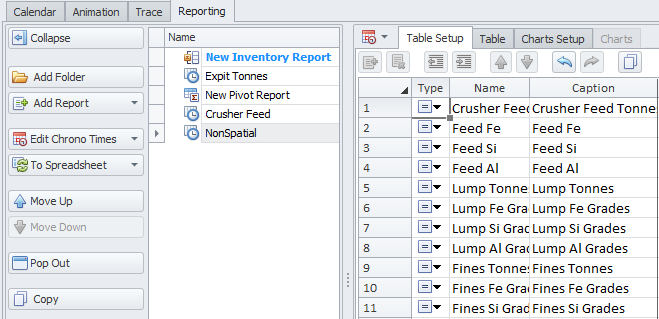
These fields appear in the Calendar and can be referenced in charts in the Reporting tab: