 OLAP Cube
An OnLine Analytical Processing (OLAP) cube is a data structure that provides fast analysis of multidimensional data.
Relational databases are, by definition, two dimensional - they have rows and columns. An OLAP cube allows efficient querying and reporting of multidimensional data. Given the complexity of multidimensional data, other reporting systems can struggle with the task; using OLAP cube the result is more rapid. The speed with which it processes multidimensional data is OLAP cube's strength.
In Pitram, OLAP Cube is one of the report types in the Reporting service. It is linked to Microsoft Excel. This means that you also have access to all the tools that are available in Excel to enhance your report - charts, format cells, pictures and more.
To work with OLAP Cube in Reporting, Excel must be installed on the client machine where Pitram Portal is operating.
The OLAP Cube Concept
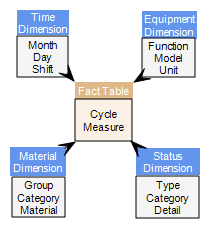
An OLAP cube is made up of a group of four facts. Each fact lists one or more values that are similar in some respect. For example, Fact Cycle by Status presents values that report facets of the cycle status - loading time, tonnes loaded, trucks Idle and others.
Dimensions are the parameters that define the reported values. A dimension is a structure that categorises data into order and is usually organised into a hierarchy. A time dimension, for example, could include shift -> day -> month -> year. This structure gives you the ability to drill down through the levels of the hierarchy. A dimension is sometimes referred to as an axis. The single point common to all dimension axes is the reported value.
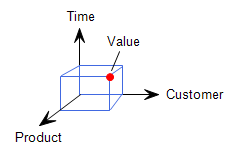
A cube is defined in two parts. Firstly, you must define the value or values that are to be reported. Then you define the dimensions needed to derive the value. The value is the measure that you want to report. A simple example of a value is Tonnes Mined. To derive the Tonnes Mined you would specify a Time dimension, an Equipment dimension and a Status dimension. For example, the Tonnes Mined on the Day Shift, 1 January, by ModelXXX loaders while Operating.
Other dimensions can be added to derive a more specific Tonnes Mined - a Material dimension, a Location dimension and others.
Using the above data model, it is possible to build reports that answer questions such as:
- What were the total Tonnes Mined per loader unit?
- What was the Tonnes Mined by Model XXX units verses Model YYY units?
- How do the production rates for Day Shift and Night Shift compare?
Terms used
Some of the terms used in relation to the OLAP cube are:
Cube
The term Cube is a short-cut for a multidimensional dataset, given that data can have an arbitrary number of dimensions. The term hypercube is sometimes used, especially for data with more than three dimensions. Each cell of the cube holds a number that represents some measure of the business, such as sales, profits, expenses, budget and forecast. A cube aggregates the facts in each level of each dimension in a given OLAP schema.
Facts and Values
A fact is a grouping of values that have similar attributes. Fact tables contain numeric values such as post codes, and additive data such as the total costs of freight for all products.
Pivot
OLAP cube provides the means to view the data with the results as columns in a spreadsheet, or to rotate or to pivot the results as rows within the spreadsheet.
Adding dimensions
You can add dimensions to generate a more specific report:
Start OLAP Cube
Do the following:
- Click the Reporting service icon
 .
. - Click Analytical Services | OLAP Cube in the report type list on the left. The OLAP Cube report definition will be displayed on the right.
You are ready to define a report based on an OLAP Cube.
OLAP Cube pane
When you have selected the OLAP Cube report type, the OLAP Cube definition pane is displayed on the right.
The pane includes the following:
Select a site
On the far-right, select the site you will be working with.
Action Name
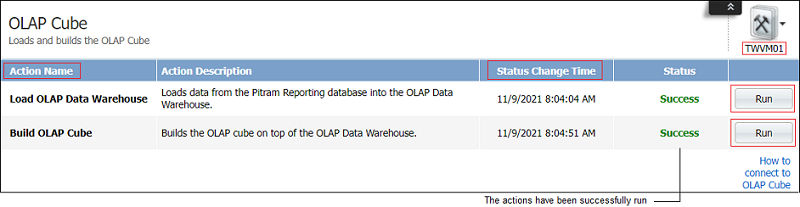
There are two actions listed:
- Load OLAP Data Warehouse. The warehouse is a subset of the Pitram database, structured to support the OLAP.
- Build OLAP CubeThis action reads the data from the warehouse and optimises it for efficient retrieval and performance.
The above two actions must be run in a top-down order before you can open the OLAP Cube definition.
Status Change Time
A subset of the Pitram database is stored in the warehouse. The date and time that it was last retrieved and last built is listed.
If more information has been saved to the database since the listed time, the actions will need to be rerun to update the data to which OLAP Cube has access.
Run
The run buttons are available to update the warehouse data. This is the dataset that will be available to the cube. These buttons are to be selected in sequence:
- Load OLAP Data Warehouse
- Build the OLAP cube
This will update the data set available in the warehouse to the cube. The status time of both actions will reflect the current time.
Connect
After the two Run functions have been executed, click the link for information on How to connect to the OLAP Cube. This is information on connecting to the OLAP cube in an Excel sheet. The Pitram Administrator on site will be able to help you with this configuration.
The workspace
The cube workspace consists of a spreadsheet on which a PivotTable Field List pane is displayed on the right.
This pane is the key to defining a cube.
The Pivot Table Field List, by default, displays a field selection area at the top and an areas selection below.
This configuration can be changed by selecting the Layout options button on the header.
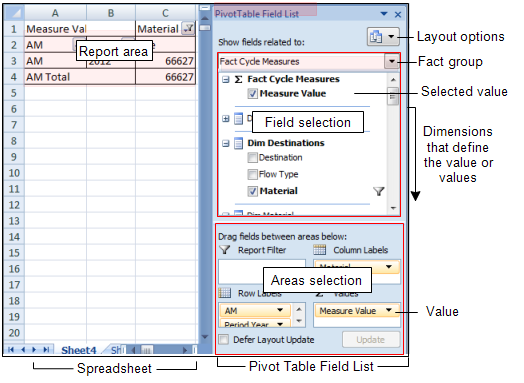
Report area
The report that you define starts at the A1 cell (top, left) of the spreadsheet.
Pivot Table Field List
An upper field selection area:
-
The facts group of values and dimension fields are displayed for selection. A dimension has one or more attributes which describe the dimension (Function, Model, Owner, for example). Most dimensions list their associated attributes as both the full hierarchy and as single attributes. For example, Dim Material lists:
-
Hierarchy. If you select this attribute, a drop-down list of all the attributes in the Material hierarchy will be available from which to select. Select either the Material Group, Material Category or Material that you want reported.
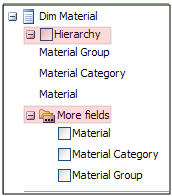
More fields:
Individually select either or all the Material, Material Category and Material Group levels. The selection will appear as individual columns or rows. Select a particular set of tokens for each column or row.
To rearrange the default PivotTable List, select the Layout options button on the right of the List header. Select the appropriate layout from the list of five.

A lower areas selection:
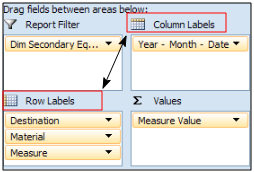
Drag the value and dimension fields into the particular areas to define the report. Changing the location of a field from a column label to a row label, will pivot the data from a vertical to a horizontally oriented report. Changing the order of the fields in an area will also change the layout of the report.
The areas are:
- Report filterDefine a field to apply a filter to the report. The filter field will appear outside the report body.
- Column labels Fields in this area will be reported as column headers.
- Row labelsFields in this area will be reported as row headers.
- ValuesDrag the value field that you are reporting into this area.
Header Here you will find options to move, close and size the Pivot Table Field List and to select the field and areas arrangement that best suits your needs.
If the Pivot Table Field List is not visible, click in the report area of the spreadsheet and it will appear again.
As you drag fields into the areas selection, your report will evolve in the spreadsheet.
Use the OLAPCubeGeneration task scheduler in System | Manage Scheduled tasks to run a report at a scheduled frequency.