Dashboard
On the Services ribbon, click Asset Health to display the dashboards showing the performance against the reading definitions you have configured for your assets.
![]()
The Asset Health module provides the Dashboard page for displaying and adding widgets to the dashboards created in Pitram.
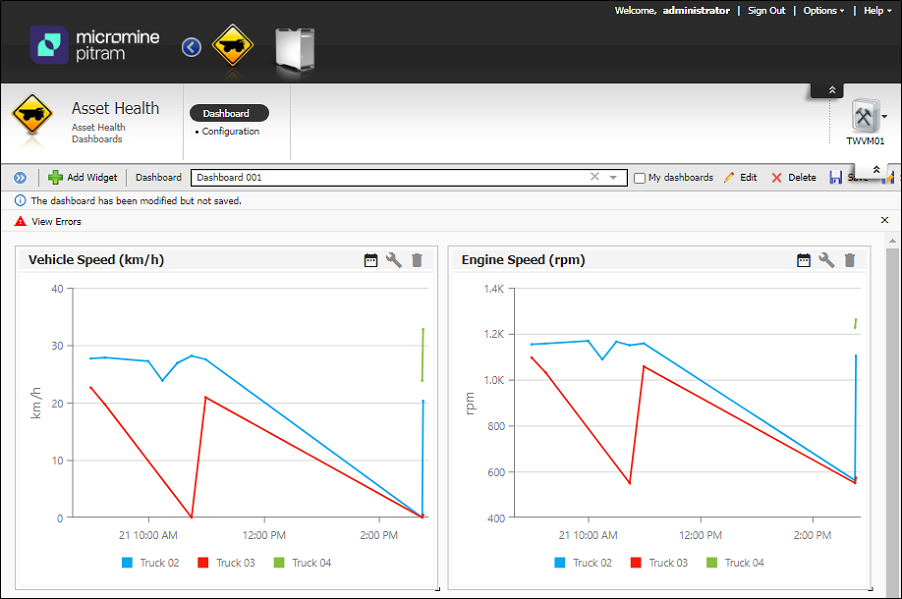
There are two available views in the Asset Health dashboard.
-
Equipment View - A broad overview, enabling comparison of readings across a range of assets.
-
Positioning Tags - A view of Positioning Tag alarms and a summary of all tags with readings.
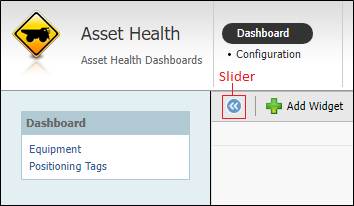
The two views are available from the menu panel at the left. The menu panel is collapsed by default and can be opened using the slider button.
The slider button toggles the display of the Dashboard panel on and off. The Dashboard panel allows switching between Equipment and Positioning Tags. Switching back to Equipment view will load the last selected dashboard.