Display Options
The Display Options form allows you to choose what to display on the Swath Plot for each input file and calculated statistic.
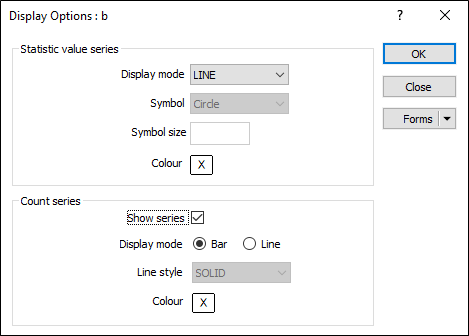
Statistic value series
Display mode
Select a (LINE, LINE + SYMBOLS, SYMBOLS) display mode for the series of statistical values.
Symbol and Symbol size
If you have chosen LINE + SYMBOLS or SYMBOLS as the Display mode, click on the Symbol icon to select a symbol, and specify a Symbol Size.
Colour
Click on the Colour icon to select a display colour for the lines and symbols displayed on the plot.
Count series
Show series
Select this option show a Count series in the plot.
Display mode
Select a Bar or Line display mode for the Count series.
Line style
If you have chosen Line as the display mode, select a (SOLID, DASH, DOT) line style.
Colour
Click on the Colour icon to select a display colour for the bars or lines displayed on the plot.