Mean
![]()
To compare the true means of two populations using a sample from each, select Difference Between Two Means from the menu.
![]()
Input
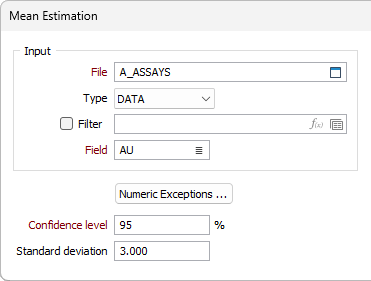
File
In the Estimation of Mean form, select a file Type and then double-click (or click on the Select icon) to select the name of the File containing the sample values. You can also click the Pick from Vizex button to collapse the form and interactively select a layer containing the file to be inserted and return to the form.
If required, define a Filter to selectively control which records will be processed.
Field
Double-click (or click on the List icon) to select the name of the field containing the values for which statistics will be generated.
Numeric Exceptions
(Optionally) Use the Numeric Exceptions group to control the way that non-numeric values are handled. Non-numeric values include characters, blanks, and values preceded by a less than sign (<).
Confidence Level
Enter a percentage that will determine the range of sample means that will include the true mean. For example, to be 90% confident, we estimate that the sample mean is somewhere in the middle 90% of the distribution of the sample means.
Increasing the confidence level has the effect of increasing the range within which the estimated mean can fall.
Standard deviation
Enter a known standard deviation of the sample. The estimate will be enhanced if you are able to enter a standard deviation for the parent population.
Forms
Click the Forms button to select and open a saved form set, or if a form set has been loaded, save the current form set.
Calculate
Click Calculate to calculate the statistics. The results are shown on the right-hand of the form. Click Copy to Clipboard to copy the results. You can then paste them into a spreadsheet or text document.
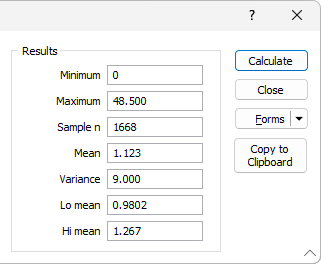
Lo Mean and Hi Mean specify the range of values within which the true mean of the parent population is estimated to lie.