Options
The Options tab of the Indicator Modelling form provides options to configure Interpolant function and Orientation method for the Indicator model. The options on the tab allow you to define one or more wireframe solids that can restrict the output wireframes to the numerical implicit Indicator modelling tool . Only data within each defined sub-domain will be used to model the sub-domain.
Use the options to select whether to define a Single Domain or Restrict to sub-domain wireframes.
Domain Settings
The fields in the Domain Settings grid are used to define the domain/s.
Interpolant
To generate a realistic implicit model, it is essential to restrict the effect of each drillhole sample to the surrounds of its local region. This is achieved using Interpolant functions which have similar options to variograms for range, sill, and nugget.
| CLASSIC LINEAR | The standard linear kernel. |
| LINEAR | A linear kernel with an option for a nugget. The slope is defined by the ratio (Sill - Nugget) / Range, whilst the effect of the nugget is controlled by the ratio Nugget / Sill. |
| Nugget is simulated by adding a small Gaussian component to the kernel, which has the tendency to produce more lumpy surfaces at each data point. | |
| EXPONENTIAL | The slope of the kernel can be adjusted by the Beta parameter (Beta >= 1). Default is 1 which corresponds to the standard exponential variogram. |
The preview chart allows you to visually see how changing the parameters affects the shape of the exponential interpolant. A purple dashed line indicates the sill, and a green dashed line indicates the range.
Using a non-zero nugget
Drift
Drift determines how the value distribution is modelled further away from the sampled data:
| NONE | The interpolant decays to zero. |
| CONSTANT | The interpolant assigns a constant value which is an approximation of the mean of the data. |
| LINEAR | The interpolant varies linearly. |
Range
If you have chosen the LINEAR
The exponential variogram never reaches the sill. The range is the point where the variogram reaches 96% of its sill value.
Nugget
If you have chosen the LINEAR
Sill
If you have chosen the LINEAR
Beta
If you have chosen the EXPONENTIAL interpolant, enter a Beta value.
Points/Sphere
In most cases it is impractical to create a single model using all the points in the data set. Instead, the data set can be divided into overlapping regions. These regions are defined by the direction of propagation of spheres across the input data:
The Points/Sphere value is the number of points you want to look at per sphere. The radius of each sphere will therefore depend on the concentration and the distribution of the points in the input data.
This value is calculated automatically based upon the input data. Unless a number is entered, the field defaults to [Auto].

If you have selected to Restrict to sub-domain wireframes, the Domain Settings grid will change to include Domain and Wireframe fields as well as the Interpolant settings.
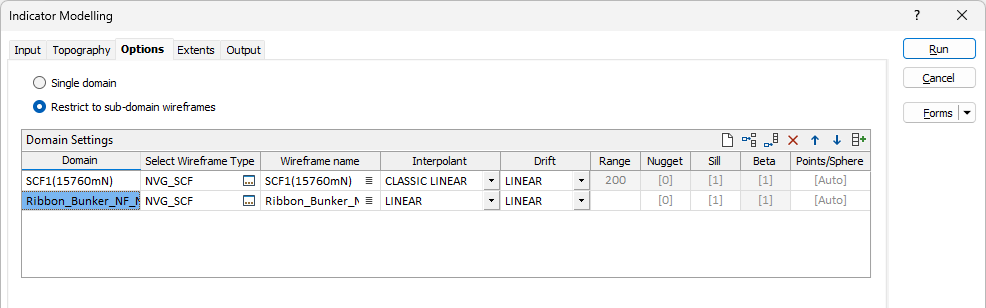
Enter an identifier for the Domain and Select Wireframe Type and Wireframe name for the domain from the fields provided. You can use the Restrict to sub-domain wireframes option to define a single or multiple domains. Use the buttons in the Domain Settings grid to Manage the rows in the list.
You can also use the Pick from Vizex button (or select the context menu option where available) to collapse the form and interactively select the required Wireframe to insert and return to the form.
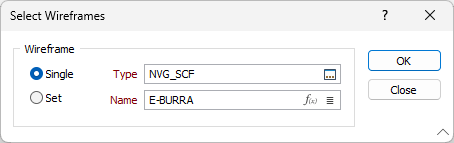
The Autofill button in the toolbar allows you to fill the Domain details from a selected single or set Wireframe Type and Name from the Select Wireframes dialog that opens:
Weighting
The Weighting grid is used to define the Weighting (local anisotropy) for each domain.
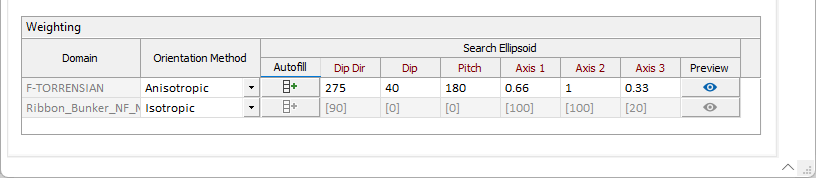
Select a Weighting option:
- When you select an Isotropic orientation method, there is no preferred direction.
- When you select an Anisotropic orientation method, you enter a preferred direction, as well as specify the weighting in that direction.
- When you select Structural Trend File, a data search weighting is derived from the direction of anisotropy defined in a (*.mmstf) Structural Trend File, which is an output of the Implicit Modelling | Structural Trend | Create Trend function.
Double-click to load an existing form set. Alternatively, right-click in the Anisotropic input box to open a form where you can define the shape and direction of the search ellipsoid.
The ability to apply a weighting based on the orientation of a data search ellipsoid is a useful option. Although it references the same set of parameters used to define a data search for block modelling, only a few of the values are utilised by implicit modelling.
For example, only the factors and rotation associated with the orientation axes are used – the radius is ignored and will be greyed out. If you consider that there is a greater correlation in one direction in particular, select Ellipsoidal, and set appropriate factor, azimuth, plunge and rotation values.
This effectively accounts for any anisotropy. Interpolation weights can be adjusted accordingly; data points located along the major semi-axis will receive a higher weighting than those located along the minor semi-axis, for similar distances from the prediction location.
You can use the Autofill button in the grid to automatically enter the direction and axis values from a selected Data Search file.
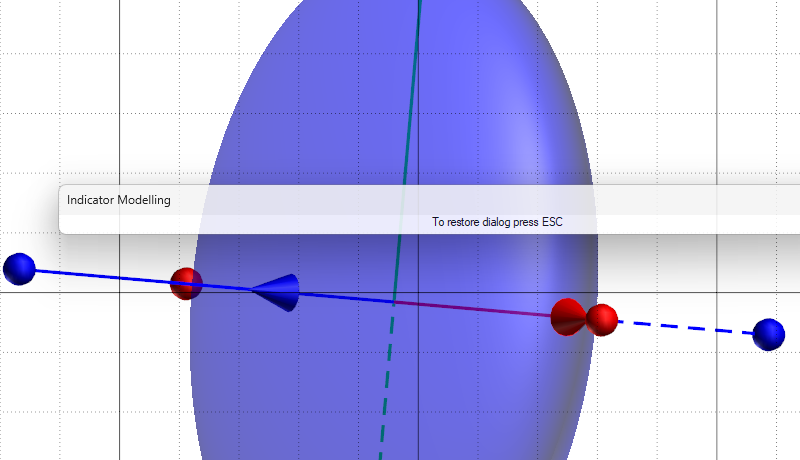
The Preview button will display a preview of the resultant search ellipse in Vizex.