Display
On the Display tab of the Coordinate Grid Settings form, you can choose whether to display labels, choose whether to display minor lines, and choose whether to display a backing (underlay) plane.
For each of these options you can alter (colour, line type, thickness, transparency) display attributes.
Display Labels
Select the Display Labels check box if you want to display labels along each axis of the grid.
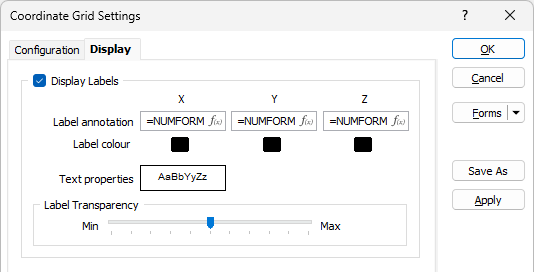
Text properties
Double-click on the Text Properties Preview box to select a font and set text properties for the labels.
Label annotation
Specify the text to be displayed for each X,Y,Z plane of the grid. To use an expression for the label annotation, click the icon to open the Expression Editor and build the expression.
Label Colour
Specify the colour to be applied to the grid labels along each axis. Note if a CROSSES grid type is selected, then crosses are coloured using the colour assigned to vertical lines.
Label Transparency
Use the transparency slider (0 - 100%) to specify the intensity of the grid labels.
Line Settings
Line Colour
Specify the colour to be applied to the grid lines along each axis. Note if a CROSSES grid type is selected, then crosses are coloured using the colour assigned here.
Line Transparency
Use the transparency slider (0 - 100%) to specify the intensity of the grid lines.
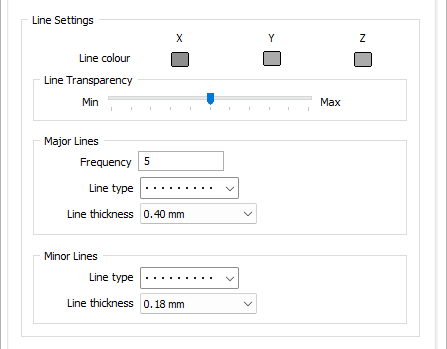
Major Lines
Major lines are the lines you want to display and optionally label using a user-defined or auto-calculated line spacing.
A Frequency setting of 0 will draw all lines as minor lines. A Frequency setting of 1 will draw all lines as major lines. A Frequency setting of n will draw every nth line as a major line.
Minor Lines
Minor Lines are additional lines inserted between the major lines. These are spaced automatically based upon the grid extents and the line spacing applied to major lines.
The existence of minor lines depends on the Frequency you have specified for major Lines. If minor lines are not required, set the Frequency setting to 1.
Line type
Select a line type. A preview of each line type is shown in the drop-down list. A variety of solid, dotted, and dashed line styles are available for selection.
Line width
Display Underlay Planes
Select this option to display the planes of the grid along each axis.
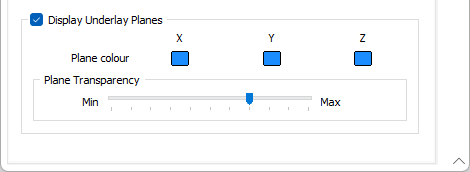
Plane Colour
Specify the colour to be applied to the planes of the grid.
Plane Transparency
Use the transparency slider (0 - 100%) to specify the intensity of the grid plane. The layers displayed below the grid an be seen based upon the degree of transparency you select for the plane.