Labels
Set the position and the appearance of grid labels on the Labels tab of the Additional Grid form.
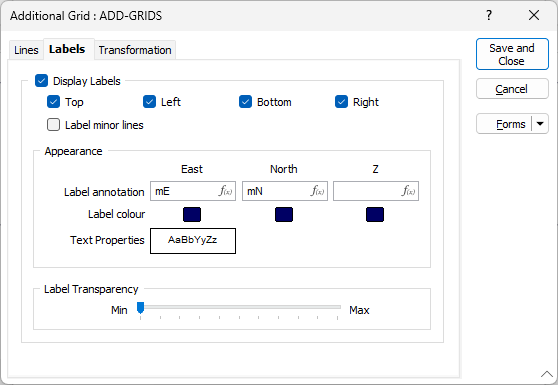
Display Labels
Select the Display Labels check box to display labels along the Top, Left, Bottom and Right sides of the grid. Use the check box options to only show labels on some sides of the grid rather than on all sides.
Label minor lines
By default major lines are always labelled (if a Major Lines Frequency has been specified on the Lines tab of the form). Select this check box if you want to label minor lines.
Appearance
Label Annotation
Specify the label annotation for each (East, North, Z) axis.
Using annotation label expressions
Most of the time you won't need to use an expression. For a simple annotation, for example to append "mE" to the coordinate values, just enter the text mE into the Label annotation field.
For more complex annotations, click the [fx] button to display the Expression Editor. If the Label annotation field already contains a simple annotation, like "mE", it will be automatically converted into the corresponding expression, in this case:
=[FormattedValue]+"mE"
You can then use this expression as a starting point for configuring your own label annotations. Or, if you click OK without making any changes, the application will retain the original simple annotation without converting it to an expression.
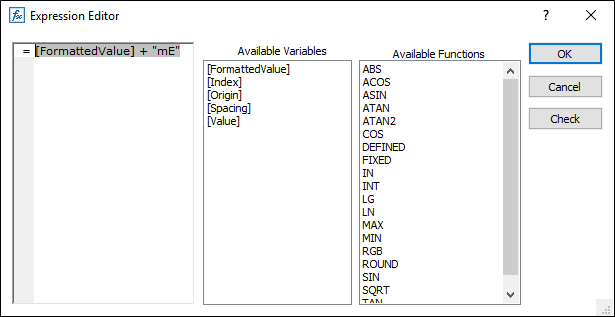
Coordinate grid annotation expressions include a number of predefined variables, most of which are dynamically updated based on the current zoom level.
- [FormattedValue]: The numerical value of the coordinate gridline, formatted using the same rules as the primary Vizex coordinate grid
- [Index]: The index number of each coordinate gridline, starting with zero at the origin and increasing by one for each subsequent line
- [Origin]: The value of the coordinate grid's origin. Remains constant regardless of zoom level
- [Spacing]: The spacing between adjacent gridlines
- [Value]: The raw numerical value of the gridline, ignoring the rules used by the primary Vizex grid. Use the FIXED function to set a specific number of decimals, for example:
=FIXED([Value], 2)
By using expressions to combine these variables, you can create complex, multi-part labels. Here are some examples:
- Coordinate value with +/- half the gridline interval:
=[FormattedValue]+"mE +/-"+[Spacing]/2+"m"
- Coordinate value with distance from origin:
=[FormattedValue]+"mE ("+ ([Value]-[Origin])+"m from Origin)"
- As above, but using [Index] and [Spacing] instead:
=[FormattedValue]+"mE ("+ ([Index]*[Spacing])+"m from Origin)"
Label Orientation
Optionally use the Orientation options to orient the labels horizontally or vertically along the Top, Left, Bottom and Right sides of the grid. Select Auto to orient the labels automatically depending on the space available on the plot frame.
You may need to manually set the margins of the parent plot frame so that the labels outside the grid are visible.
Label colour
Double-click on the Colour icons to select a colour for the labels along each axis.
Label font
Double-click on the Text Properties Preview box to select a font and set text properties for the labels.