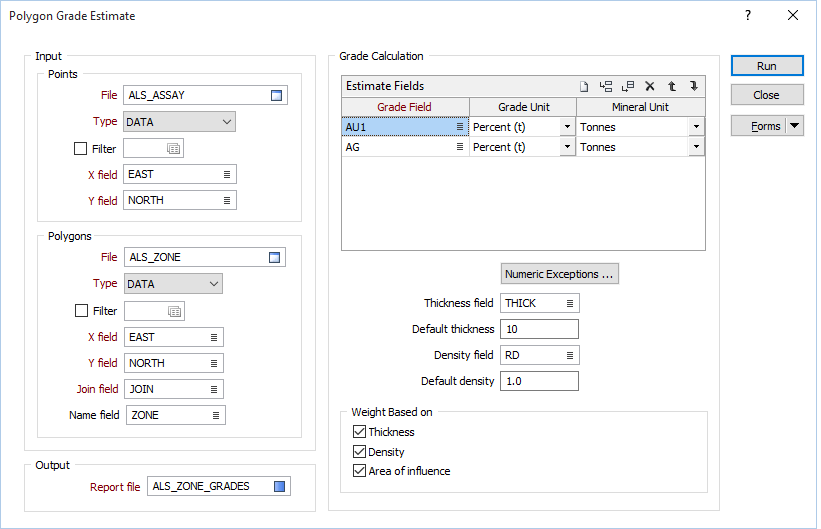
Polygon Grade Estimate
![]()
The grade is calculated as either the simple average of the points, or as the weighted average of the points inside the selected polygons (if a weight field is specified). If multiple polygons are selected, the area of the polygons is not used to weight the grade.
Inputs to the process are a Points file that contains the raw grade values and a String file that contains the polygons that define the areas to be reported.
When you run the function, Perimeter length, Area, Grade, Volume and Tonnage values will be calculated and written to the specified Report file.
Input Points
The point file contains the raw grade values. Because we are dealing with a polygonal estimate, no Z value is needed.
File
Select a file type and then double-click to select a file that contains points with raw grade values. If required, define a filter to selectively control the records to be processed.
X and Y fields
Specify the names of the X and Y coordinate fields in the Points file.
Input Polygons
The Polygon file defines the reporting shapes. The Name field is used as an identifier for each polygon in the report. If not defined then 001, 002, 003 etc. will be used.
File
Select a file type and then double-click to select the file that contains the polygons you want to calculate grades for. If required, define a filter to selectively control the records to be processed.
East and North fields
Specify the names of the Easting and Northing coordinate fields in the Polygon file.
Join field
Specify the name of the field containing values which define whether data points will be joined by a line. The values of this field in successive records must be the same before the points will be strung.
Name field
(Optional) Double-click to select the name of a field in the Points file that contains ID values that can be used to identify each polygon in the report. If not defined then 001, 002, 003 etc. identifiers will be used instead.
Output
Enter (or double-click to select) the name of a Report file. When you run the function, Perimeter length, Area, Grade, Volume and Tonnage values are written to this file.
The decimal precision of the grades written to the Report file is the decimal precision of the Grade in the input points file, plus one extra decimal place.
Grade Calculation
Estimate Fields
Multiple grade fields can be calculated. These fields are in the Points file. Use the buttons on the grid list toolbar to Manage the rows in the list.
Numeric Exceptions
(Optionally) Use the Numeric Exceptions group to control the way that non-numeric values are handled. Non-numeric values include characters, blanks, and values preceded by a less than sign (<).
Thickness and Density fields
(Optional) Double-click to select the names of the fields in the Points file that contain Thickness and Density values. These values are needed for reporting volume, and may also be selected as weighting factors (see below).
Thickness and Density defaults
Default Thickness and Density values are not compulsory. A defaults value of 1 is assigned if these fields are left blank.
Weighting Based On
Any combination of (Thickness, Density and Area of Influence) weighting factor options may be selected.
If no weighting factor options are selected, a simple weighted average of all the points in each polygon is used.
For example, if the grade values are taken from data that has been sampled over different lengths, choose Thickness weighting and choose the Sample Length field as the Thickness field.
If both Thickness and Density are selected, or all three options are selected, those values are multiplied to arrive at the final weighting factor.
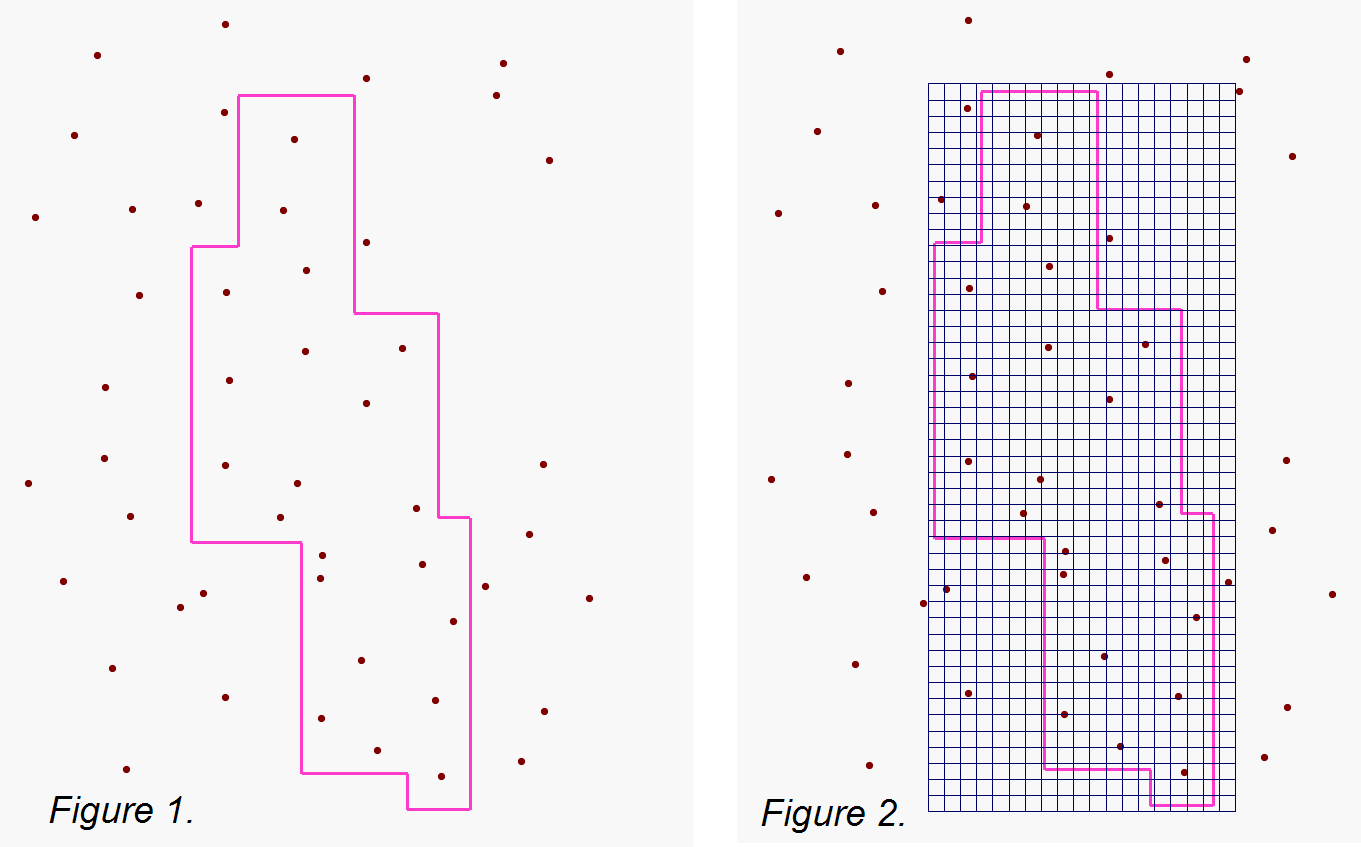
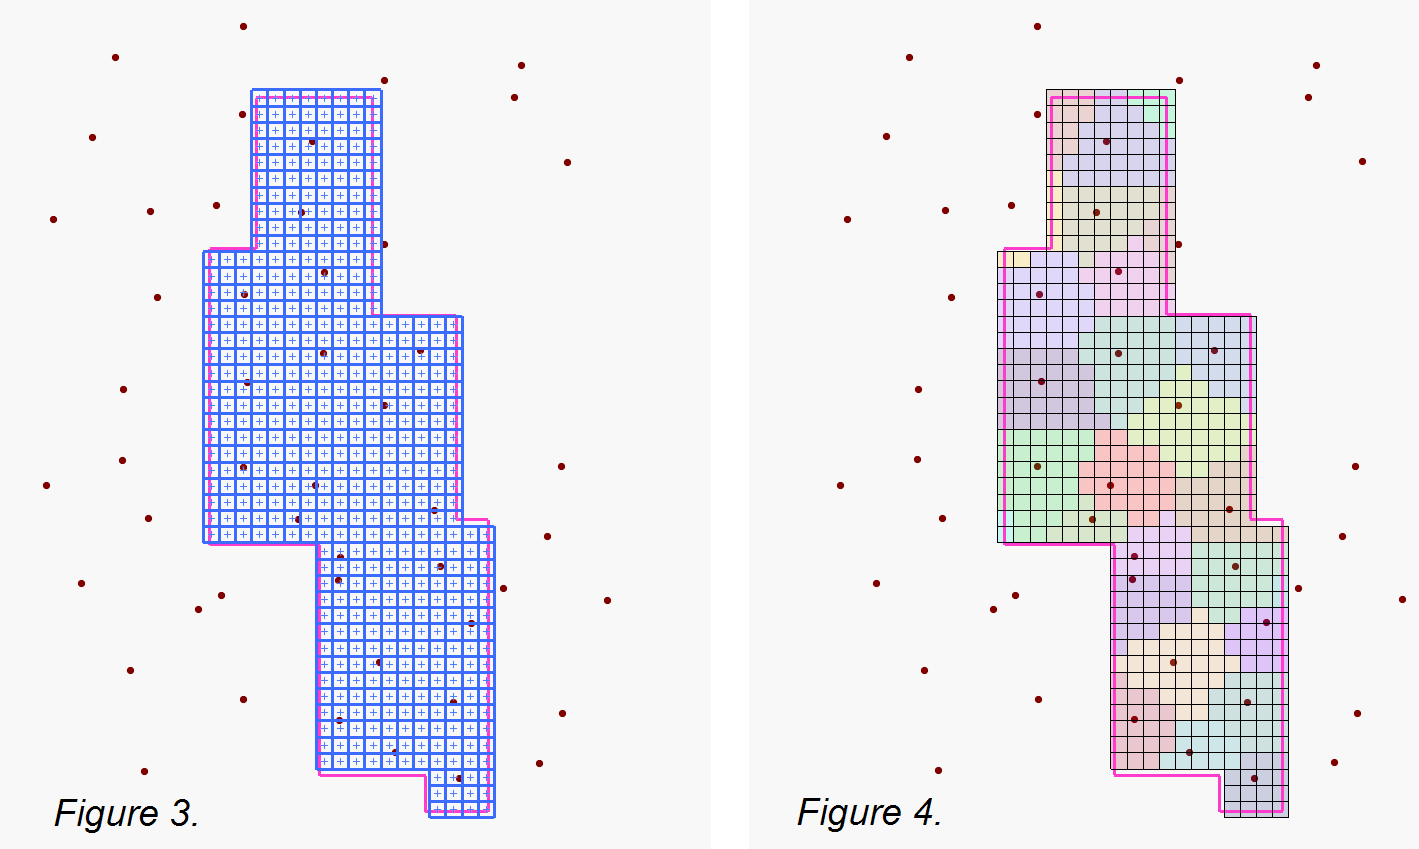
Area of Influence weighting:
- Start with points, that have grade values, and a polygonal area (Figure 1).
- Generate a mesh of cells, covering the polygonal area (Figure 2). Note that the mesh used by this function is much (much) denser than the one shown. In the diagram, each cell represents 400 (20x20) actual cells. The cell size is calculated by dividing the square root of the polygonal area by 500.
- Cells, with centres outside the polygonal area, are removed (Figure 3).
- Each cell is given the value of the closest grade point (Figure 4). Note that the closest grade point might be outside the polygon.
- The average, of all the cell centre values, is calculated to determine the Area of Influence grade.