Display
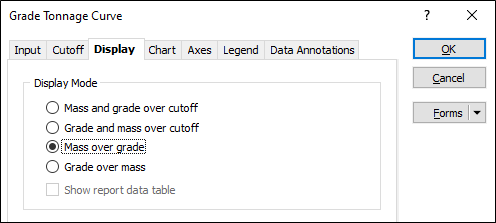
On the Display tab of the Grade Tonnage Curve form, you can select options that determine the layout, the cutoff points, and the scale of the chart:
Display Mode
You can choose from four display modes that determine which data is shown on which (x, y, y2) axis of the chart, and how the Series type is displayed.
Use the Advanced options on the Axes tab to set the decimal format of the values shown on each axis.
- Mass and grade over cutoff. Cutoffs are listed on the x-axis, mass on the y-axis, and average grade on the secondary y-axis.
- Grade and mass over cutoff. Cutoffs are listed on the x-axis, average grade on the y-axis, and mass on the secondary y-axis.
- Mass over grade. Mass is listed on the y-axis, average grade on the x-axis. Each point can be labelled with its cutoff value.
- Grade over mass. Average grade is listed on the y-axis, mass on the x-axis. Each point can be labelled with its cutoff value.
You also have the option to hide or show a data report table below the graph.
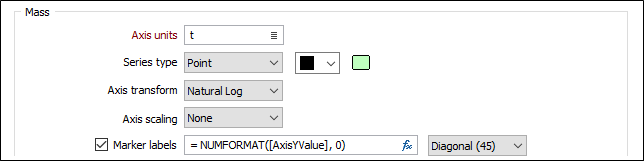
Mass
The following options are enabled unless you have chosen Grade over Mass as the Display Mode:
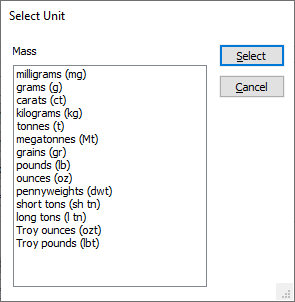
Axis units
Choose the units which determine how the mass is calculated.
Series type
Select a Series type which determines how the series of data points are shown on the chart.
Axis Transform
Choose a transformation option from the drop-down list:
- LINEAR When this option is chosen, the actual values in the Graph field are used subject to the settings in Numeric Exceptions.
- NATURAL LOG When this option is chosen, the values in the Graph field are converted into their natural logarithm. In this case, the minimum data value specified by the graph minimum must be greater than zero (since the Ln of zero is - infinity).
Axis Scaling
Choose a (Thousands, Millions, Billions) scaling option from the drop-down list or select None. The Mass values on the axis of the chart are accumulated based upon the scaling option you have selected and an appropriate label is appended to the axis title and the legend.
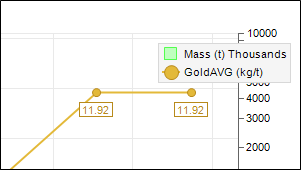
Marker labels
Select this option to show cutoff labels. An expression can be used to format the label values. Variables pertinent to the chart are available for selection.
Common changes include:
- Prescribing the amount of numbers after the decimal.
- =NUMFORMAT([AxisYValue], X). X controls the decimal places.
- Adding commas to a number.
- This depends on your windows locale settings.
Label orientation
Select a Horizontal, Vertical or Diagonal orientation for the labels:
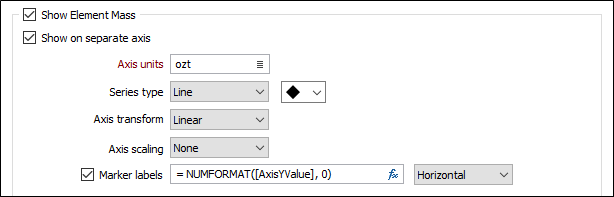
Show Element Mass
Select this option to show the element mass on the chart. The option to Show on a separate axis is then enabled.
Axis Units
If you have selected the Show on a separate axis option, choose the units which determine how the element mass is calculated.
Series type
Select a Series type which determines how the series of data points are shown on the chart.
Axis Transform
Choose a transformation option from the drop-down list:
- LINEAR When this option is chosen, the actual values in the Graph field are used subject to the settings in Numeric Exceptions.
- NATURAL LOG When this option is chosen, the values in the Graph field are converted into their natural logarithm. In this case, the minimum data value specified by the graph minimum must be greater than zero (since the Ln of zero is - infinity).
Axis Scaling
Choose a (Thousands, Millions, Billions) scaling option from the drop-down list or select None. The Mass values on the axis of the chart are accumulated based upon the scaling option you have selected and an appropriate label is appended to the axis title and the legend.
Marker labels
Select this option to show cutoff labels. An expression can be used to format the label values. Variables pertinent to the chart are available for selection.
Label orientation
Select a Horizontal, Vertical or Diagonal orientation for the labels:
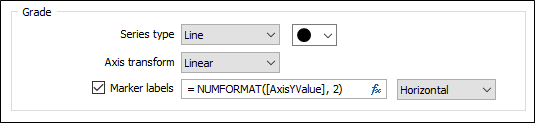
Grade
The following options are enabled unless you have chosen Mass over grade as the Display Mode:
Series type
Select a Series type which determines how the series is shown on the chart.
Axis Transform
Choose a transformation option from the drop-down list:
- LINEAR When this option is chosen, the actual values in the Graph field are used subject to the settings in Numeric Exceptions.
- NATURAL LOG When this option is chosen, the values in the Graph field are converted into their natural logarithm. In this case, the minimum data value specified by the graph minimum must be greater than zero (since the Ln of zero is - infinity).
Marker labels
Select this option to show cutoff labels. An expression can be used to format the label values. Variables pertinent to the chart are available for selection.
Label orientation
Select a Horizontal, Vertical or Diagonal orientation for the labels:
Forms
Click the Forms button to select and open a saved form set, or if a form set has been loaded, save the current form set.
By design, the Forms button is not available for loaded Vizex layers (i.e. when opening the form set properties of a layer in the Vizex Layer Display pane). In Vizex, the Forms button is only available for new forms opened via the Home tab or the Vizex tab, in the Layers group (or by double-clicking on a form type node in the Vizex Layer Types pane).
Save and Save As
Click the Save button to save the changes you have made to the form set. Click Save As to save your changes as a new form set. Save As will default to the first available form set number.
Reset
Click Clear to clear the form of all values and reset the form to its default state. In the case of tabbed forms, set the first tab as the active tab.
Undo and Redo
Click Undo (CTRL + Z) to undo recent changes in the form. After an Undo, click Redo (CTRL + Y) to restore the last change that was undone.
Collapse
Collapse (roll-up) the form to preview a chart, or preview the results of an operation in Vizex, or obtain input values from Vizex, the Property Window, the File Editor, or the Plot Editor.