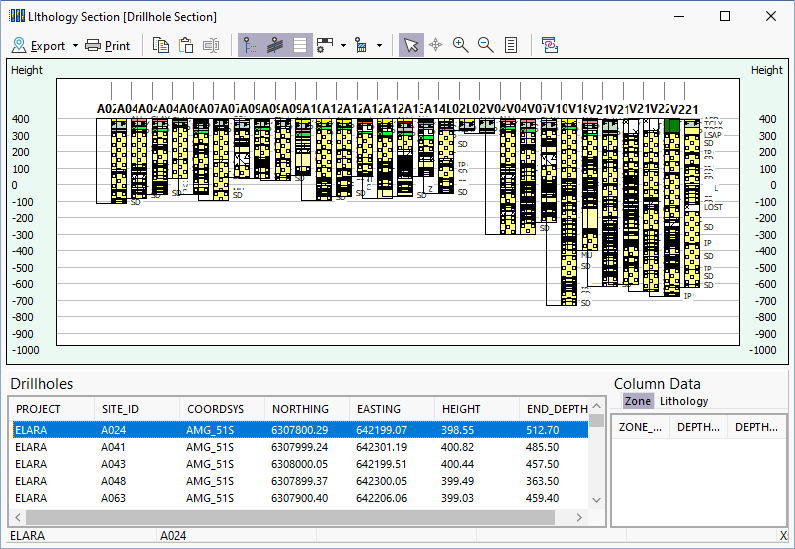
Просмотр в разрезе
Основная цель вида в разрезе - разрешить проверку и изменение идентификаторов, назначенных именованным зонам, например, угольным пластам. Диаграмма ориентирована в первую очередь на осадочные среды, где важную роль играет соотношение экономических или геологических горизонтов.
В Micromine Geobank, если просмотр в разрезе или корреляционная диаграмма открывается через Вид в плане, запрос выполняется на основе скважин, выбранных из плана (или загруженных через ранее сохраненные Списки скважин).
Примечание: в раскрывающемся списке Просмотр в разрезе будут перечислены все настроенные корреляционные диаграммы, а не только те, которые назначены текущему профилю.
Во (missing or bad snippet) вы можете использовать следующие инструменты:

|
To export the section view, select an option from the Export tool menu. You can save the current view as an image, copy the image to the clipboard, mail the image as an attachment in an email, or save the image in a format that can be viewed in Google Earth. |

|
Click the Print button to print the current view. |

|
Click Copy (CTRL+C) to copy the selected interval code to the clipboard. |

|
Click Paste (CTRL+V) to paste the interval code that was copied to the clipboard.. |

|
Data cannot be edited directly in the data grid at the bottom of the section view window. However, the Rename interval button can be used to invoke the Именованные интервалы Editor. |

|
To toggle the secondary column annotation on and off, click the Show Annotation button. Clicking the Fit To Page button will automatically turn annotation off. Line styles, colours, and the font characteristics of the annotation are configured in the Configuration | Display page of the Вид в плане Property Editor. |

|
Join lines between zones can be displayed by selecting the Enable automatic joining of intervals option as part of the Редактор свойств столбца разреза of the diagram. The Show Join Lines button toggles the display of join lines. |

|
To toggle the display of static horizontal line across the width of the section view for the purpose of checking depth alignments, click the Show Depth Grid button. |
|
|
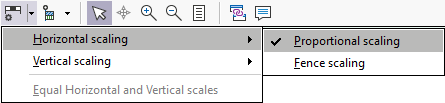
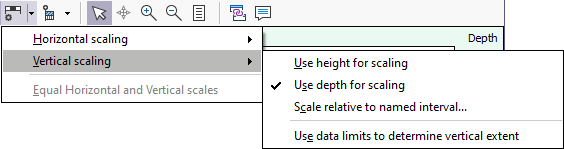
Choose the appropriate Horizontal and Vertical scaling options.
Horizontal Scaling
Vertical ScalingBy default, height values will be retrieved from the HEIGHT_FROM and HEIGHT_TO columns in the downhole result set. These values should represent the height (above datum) corresponding to the DEPTH_FROM and DEPTH_TO values respectively. If the height columns are not included in the result set, then height values are calculated from the depths below collar, based on the assumption that the drillhole is vertical. Vertical ExtentShow entire length of the drillhole is the default option. The Use actual downhole data to determine vertical extent option allows you to override this behaviour by instructing Micromine Geobank to use the downhole data to determine the vertical extent. See: Возможность определения протяженности по вертикали по данным инклинометрии Equal Horizontal and Vertical ScalesSelect this option to fix the Horizontal scale relative to the Vertical scale. This allows the true dip of seams and horizons to be seen. The Scale relative to named interval option allows you to use a column that represents a named interval (set on the Configuration | Advanced page of the Section Column property Editor) to determine the vertical extent of the view. |
 |
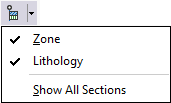
Use the Section Columns tool menu to select the columns to display in the section view:
|

|
Click the Select tool to select drillhole intervals in the section view. |

|
Use the Pan tool to put the view into Pan mode. When the view is in Pan mode you can pan the view left and right, or up and down, by clicking and dragging the mouse. |

|
Use the Zoom In option to enlarge a specified interval. Select the zoom tool on the toolbar, then click-and-drag on the image to outline the area of interest. The selected hole and interval will be expanded to fit the viewing area. Click the Zoom Out button to restore the original view. |

|
Click the Fit To Screen button to fit the entire length of the drillholes in the section view. This action will automatically turn off annotation to avoid clutter. (See "Annotation button" above). |

|
Click the Connectivity tool to spatially select a hole or a boundary that will then be queried (typically to create a downhole or a lease summary graphic report. |
| The Connectivity tool is designed to work with the standard field names PROJECT and SITE_ID. See: Подключение | |

|
Click the Reload Substitutions button to open the Substitution Parameters dialog to reconfigure and reload the Correlation Diagram. |