Haulage
This topic introduces the fundamental concepts of haulage simulation. Truck haulage and haulage related costs can account for up to 50% of the total operating costs incurred by an open-cut mine. As such, under-performance or poor planning can impact strongly on the mine’s productivity and the bottom line. Haulage simulation plays an important role in identifying opportunities for improvements, testing the viability of haulage plans and managing considerable financial assets.
Running haulage simulation and analysis requires both a multi-step setup and the use of Haulage Logic controls. The setup includes providing an input schedule, relevant equipment/truck specifications, road specifications (speed restrictions and segment codes), and the creation of haulage networks.
For more information, see: Haulage Setup
Rolling Resistance
Central to the cost of truck hauling is the concept of rolling resistance. Generally expressed as a percentage of a truck’s weight, rolling resistance is the force that resists the rolling of a wheel or other circular object along a surface caused by deformations in the object and/or the surface.
The table below (Carvill, 1989) shows example rolling resistances for pneumatic tyres on various road surfaces.
| Road Surface | Rolling Resistance |
| New Asphalt/Concrete | 0.01 (1%) |
| Worn Asphalt/Concrete | 0.02 (2%) |
| Rolled New Gravel | 0.01 (1%) |
| Loose Worn Gravel | 0.04 (4%) |
| Medium Hard Soil | 0.08 (8%) |
| Sand | 0.1 – 0.2 (10 - 20%) |
Reference: Carvill, J. (1993): Mechanical Engineer’s Data Handbook
Effective Grade (or Static Force)
Rolling resistance is combined with the grade of a slope to determine the effective grade (or static force applied to the truck). In up-hill calculations, the effective grade (resistance) % = grade % + rolling resistance %, and conversely for down-hill calculations the effective grade % = grade % - rolling resistance.
Example Effective Grade:
Taking a loaded truck of 376t (GVM) as an example, on a uphill ramp of 8% grade and a rolling resistance of 2%, the effective grade will be 10% and the static force on the truck will be 376 x 0.1 = 37.6tf (or 37,600 kgf).
Please note: This isn't quite the maths, this has been simplified to avoid learning too much physics. Your static force will be around 1% less than this, if you're interested in static force calculations please visit https://youtu.be/Vpq877lvG_M as a starting point.
Truck/Fleet Performance
Once your haul environment has been determined, the next stage is to choose which truck fleet options you wish to simulate. The following details what parameters of truck performance are used in the application.
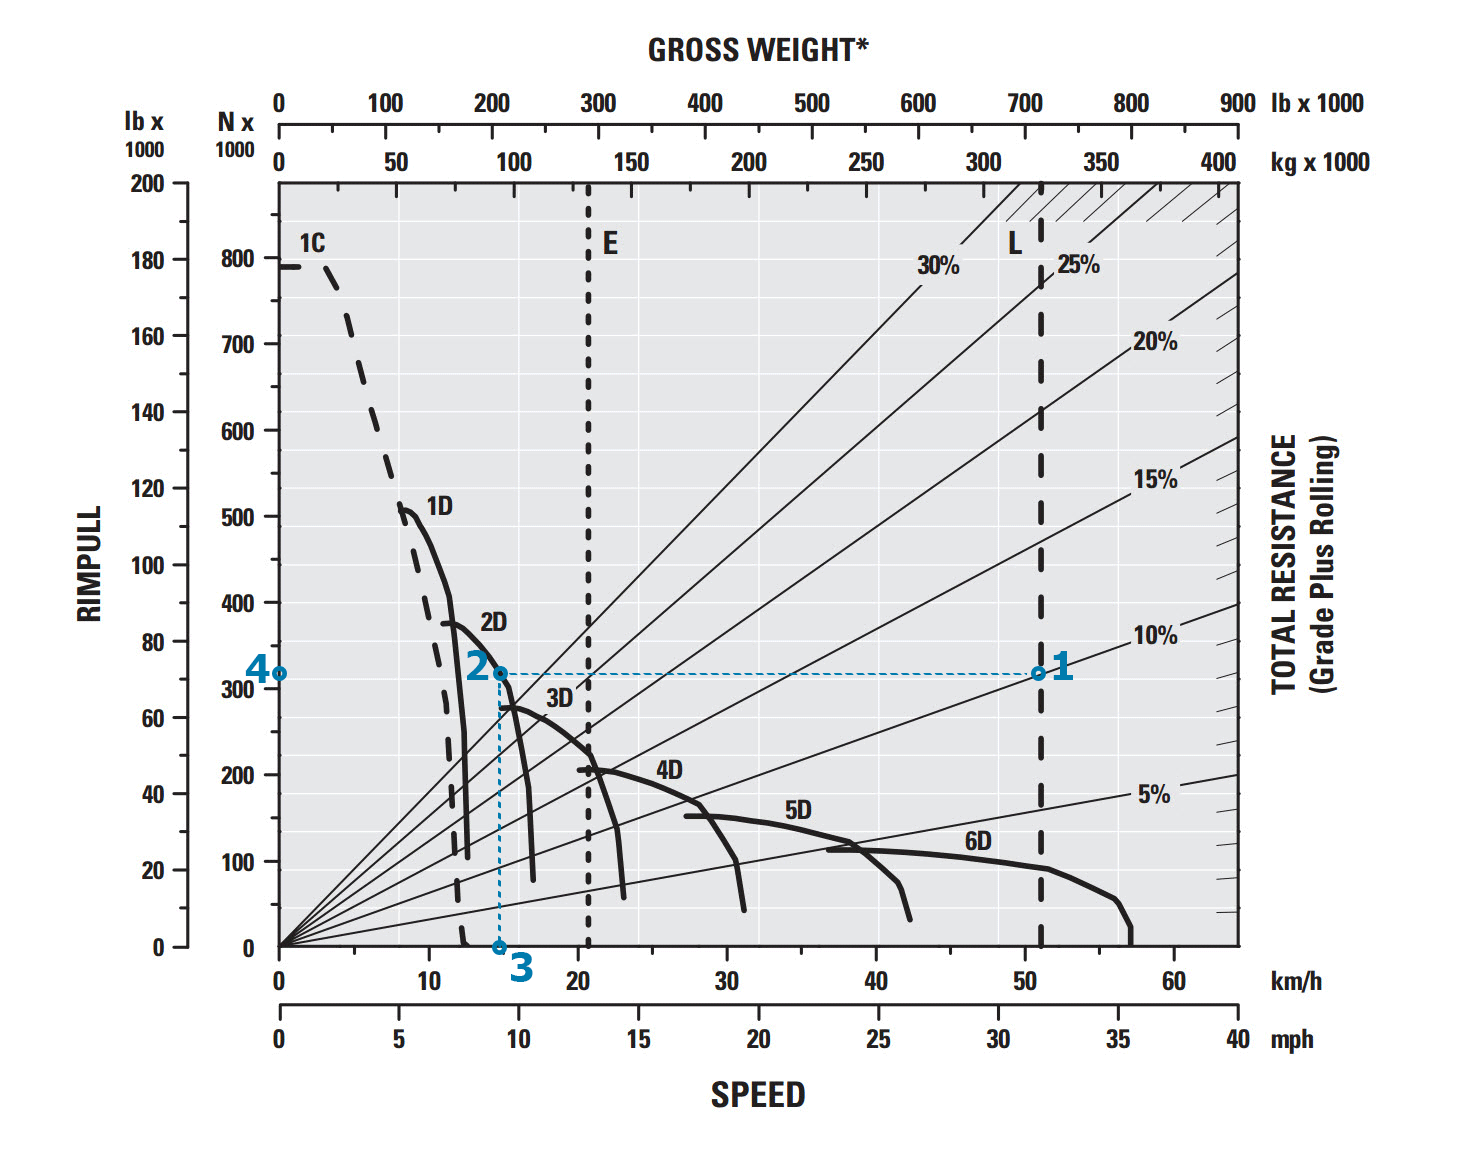
Rimpull is the force available between the tyre and the ground to propel the machine (limited by traction) and it is measured at the wheel so includes all transmission losses. Rimpull curves are used to determine the maximum speed attainable, gear range and available rimpull when machine weight and effective grade are known.
Micromine Spry has a truck database which includes over 100 common mining truck/engine combinations. If you wish to enter your own data, it is important to note that scales and units on rimpull charts range from linear to logarithmic and can use kg force, kN or lb force.
Example: If a fully loaded (324t) Caterpillar 789D travels up a 10% effective grade, there are two ways to determine the maximum speed attainable. Manually reading a rimpull graph involves
- 1. Finding the effective grade (10%)
- 2. Drawing left to the rimpull graph (~320,000N rimpull, 2nd gear)
- 3. Drawing down to the speed (~14.8km/h)
If no grade lines are available calculate the rimpull by multiplying the effective grade by the vehicle weight. In this example, 324,319 kg * 10% = 32,432 kgf or 318,048N (see 4. Below) and draw right.
Retard/brake performance curves determine the speed that can be maintained when the truck is descending a grade with retarder applied. For most trucks what this means is there are 5 or 6 (depending on gears) maximum descent speeds a truck can maintain. You can read a retarding curve in the same way as a rimpull curve.
Editing rimpull data and retard data in the application is generally not required (or recommended), and small changes generally do not effect results by a significant amount. If your schedule throws an error due to rimpull or retard data not being sufficient, you may need to look at your haul profile to make sure it is accurate rather than changing the rimpull.
TKPH
Tonne kilometre per hour (TKPH) is the measurement of the work load of a tyre and is based on the weight and speed that the tyre can handle without overheating and causing it to deteriorate prematurely. A TKPH rating for a tyre is the theoretical maximum workload it can take (average weight on the tyre * average speed of the truck OR more specifically, tonnes * km/h).
Example: On one axle, the truck has two tyres. The total load on the axle is 100 tonnes when the truck is loaded and 50 tonnes when the truck is empty. The average load on the axle is 75 tonnes which is 37.5 tonnes per tyre. If the average speed of the truck is 20km/h, the tyre rating would need to be 37.5*20 or 750 TKPH in order for TKPH to not be a limiting factor.
Coefficient of Traction
Note: Coefficient of Traction rarely enters into the frame and this part of the documentation is for completeness.
Coefficient of traction or friction refers to the maximum frictional force that can be produced between surfaces without slipping. The table below from Noon (1994, see reference below) is a selection of values that represent reasonable averages between tyre and road.
| Surface Type | Coefficient of Friction (µ) |
| Gravel and dirt road | 0.35 |
| Wet, grassy field | 0.20 |
| Dry asphaltic concrete | 0.65 |
| Wet asphaltic concrete | 0.50 |
| Dry concrete | 0.75 |
| Wet concrete | 0.60 |
| Snow | 0.20 - 0.25 |
| Ice | 0.10 - 0.15 |
| Loose moist dirt that allows tyre to sink about 5cm | 0.60 - 0.65 |
Bear in mind that the more water present on the road, the lower the coefficient of friction. As little as 0.4mm of water should be considered “wet” (Tulloch, Stocker 2011).
Noon, R.K. (1994): Engineering Analysis of Vehicular Accidents, CRC Press, Boca Raton.
Tulloch, D. and Stocker, D. (2011) Coal Mine Haulage Network Surface Friction Report (http://mines.industry.qld.gov.au/assets/mines-safety-health/Coal-Mine-Road-Network-Surface-Friction-Report-2011.pdf)