Short Interval Control
In the Short Interval Planning panel, a more tabular view of the tasks created in the Shift Planner are shown, together with a progress graph.
Expected start times, Actual start times, and Task percent complete, are shown in a data grid. The table can be sorted by any of the fields in the data grid by simply clicking on one of the Column field headers.
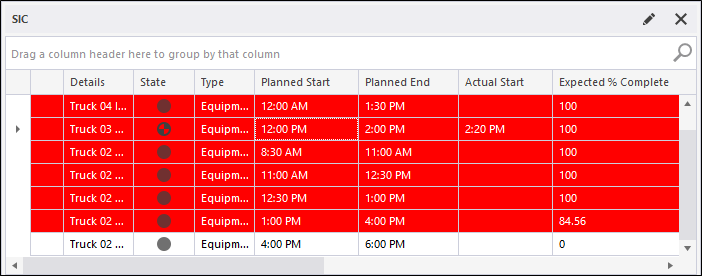
Tasks that fall outside the allowable variance thresholds (specified when you setup a Short Interval Control Panel) are displayed in Red and Amber.
The following icons provide an indication of task status:
|
|
This icon indicates that the task has been allocated to equipment or a location, but has not started. |
|
|
This icon indicates that a task allocated to equipment or a location has started. |
|
|
This icon indicates that the task is suspended. When a task has been suspended it can be resumed. |
|
|
This icon indicates that the task is complete. After a period of time has elapsed, completed tasks are removed automatically from the shift plan. |
|
|
A warning icon indicates that the task is behind schedule. |
Progress Graph
As you switch between tasks you can visually see the state of progress.
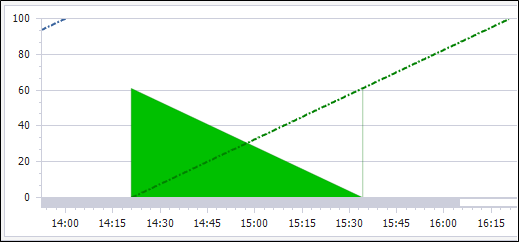
In the example shown above, the two parallel lines represent the expected start time and the actual start time. We can see that the expected start time was 9.15, while the actual start time was 9.48. Measures recorded for the tasks performed as part of the plan are shown in green.