On-site, it is important to monitor the haulage distance of vehicles (typically trucks) so that tyre wear remains within acceptable limits. Haulage distance are monitored for any vehicles fitted with GPS.
If an Alert is raised, it may be necessary to re-assign vehicles to shorter haulage routes or even replace them and set their maintenance state to tyres. You can create TKPH panels to show TKPH Calculations for different categories of vehicle.
To setup a TKPH panel:
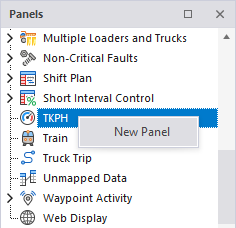
- In the Panels tab of the Display pane, right-click on TKPH and select New Panel.
- Enter a Name for the panel.
- Select the Equipment units against which tonnes-kilometres-per-hour will be recorded; choose All Equipment, a predefined equipment reference group or individual equipment units.
- Select the TKPH Measure - this will usually be Tonnes Km.
- Click Finish to exit and create the new panel (or Cancel to exit without saving).
To display a TKPH panel:
-
Click the plus box to expand the TKPH node in the Panels tab of the Display pane.
The TKPH panels you have created are listed underneath.
- Click the mouse on the name of a panel and drag and drop it onto an open Canvas.
To view the panel in future, simply open the canvas.
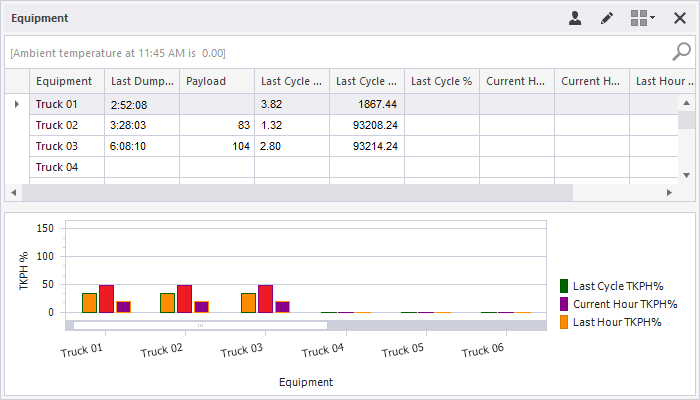
Equipment units are listed alongside a graph that shows TKPH readings as a bar chart.
For information on the options available in the toolbar for the panel, see Panel Toolbar.
Grid Columns
| Column | Description |
|---|---|
| Equipment | Token code of the equipment. |
| Last Dump Time | Time when the last dump was performed. |
| Payload | Dump quantity of the last cycle. |
| Last Cycle Distance (km) | Distance made by the truck between the previous dump time and the last dump time. |
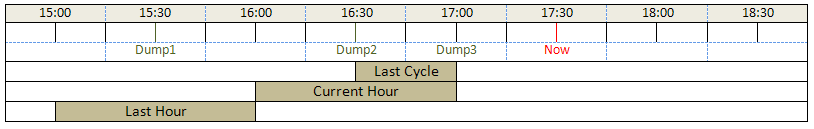
| Last Cycle TKPH | TKPH calculated for the time interval between the previous dump time and the last dump time (PreviousDumpTime, LastDumpTime). |
| Last Cycle % | Last Cycle TKPH / TKPH Maximum * 100. |
| Current Hour TKPH | TKPH calculated for the time interval between the last dump time -1 hour and the last dump time (LastDumpTime - 1h, LastDumpTime). |
| Current Hour % | Current Hour TKPH / TKPH Maximum * 100. |
| Last Hour TKPH | TKPH calculated for the time interval between the last dump time – 2 hours and the last dump time – 1 hour (LastDumpTime - 2h, LastDumpTime - 1h). |
| Last Hour % | Last Hour TKPH / TKPH Maximum * 100. |
Cycle
A Cycle is defined as a trip of the truck between two consecutive dumps (dump -> dump).
If there is no previous dump (in the case of the first dump), then the cycle is defined as (load -> dump trip of the truck).
Graph Axis X
Shows equipments (also listed in the grid). For each unit of equipment, 3 graphs are displayed from left to right.
- Last Cycle %
- Current Hour %
- Last Hour %
Graph Axis Y
Shows the percentage value. The colour of the columns depends on whether a threshold or a maximum value has been reached.
- Blue: 0 < AmberAlertThreshold
- Yellow: greater than AmberAlertThreshold and smaller than RedAlertThreshold
- Red: greater than RedAlertThreshold and smaller than MaximumThreshold
- Grey: greater than MaximumThreshold