Numeric
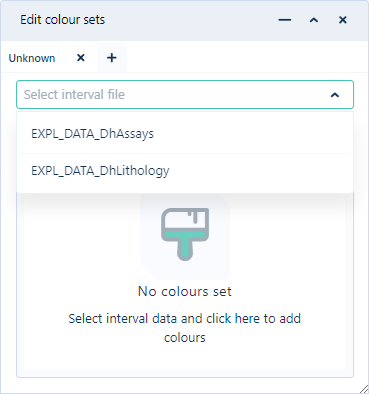
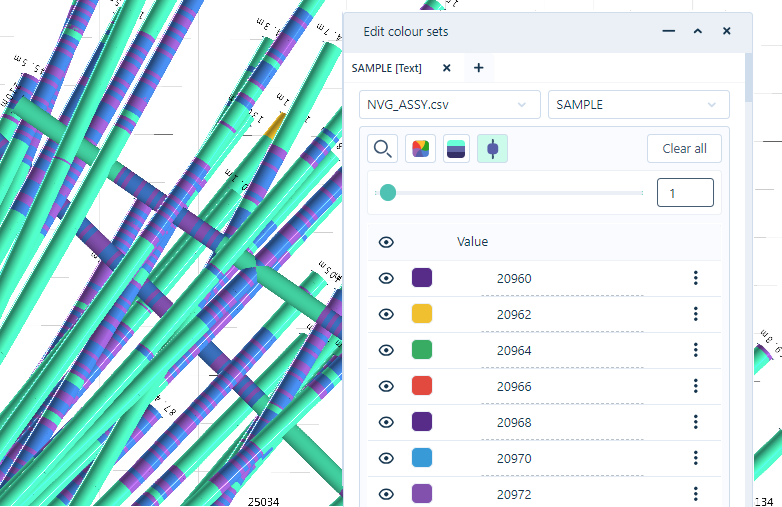
The Edit colour sets panel is used to create colour sets to be applied to the drillhole databases displayed in the Viewer. You can select the Interval file to assign a colour set for from the drop down list of the available interval files.
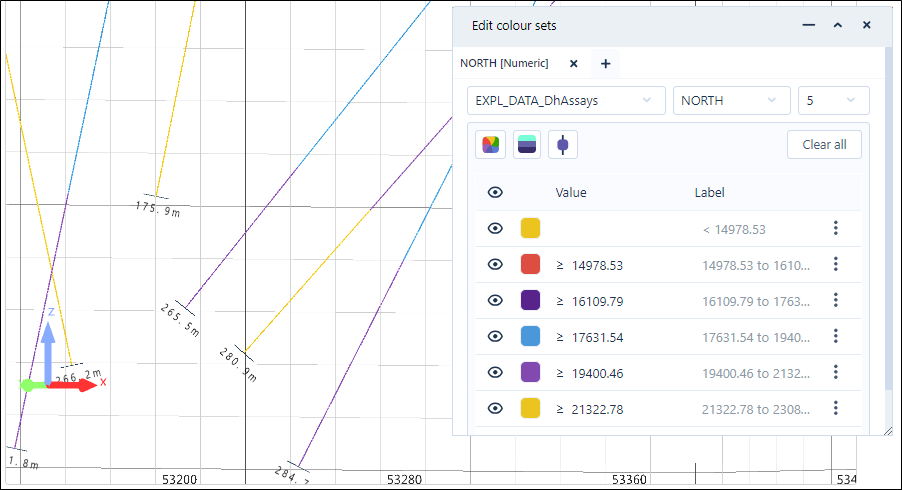
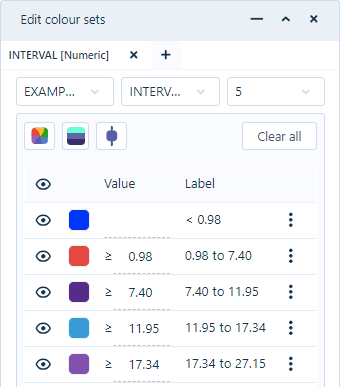
If you select a Numeric Interval file from the drop down, the numeric depth ranges for the drillholes can be configured.
About Numeric Intervals
The Numeric codes displayed in the Edit colour sets panel represent the interval depth range for the drillhole database and a colour can be assigned to each code.
Numeric type fields in Micromine Origin & Beyond (MMO&B) can contain some symbols. In this case, there are two ways in which these values will be processed.
-
If the symbol precedes the numeric value - e.g. “>2.3”, “<5.67”, “g/t4.5” - it will be processed as blank, i.e. it will be ignored.
-
If the numeric value precedes the symbol - e.g. “2.3g/t”, “2.5@” - it will be processed as “2.3” and “2.5” and taken into range calculation.
Binary fields from MMO&B cannot contain symbols; only numeric values can be stored in a binary field, so these rules do not apply - every blank value is ignored.
If a field contains duplicate values, the number of ranges can be reduced, depending on the number of duplicate values. Nexus will display a message when the number of ranges have been reduced.

If the field does not contain any values, it is blank and cannot be selected. Nexus will display an error message:
![]()
Ranges are calculated using a method similar to Percentile mode in MMO&B: All the values in the field are ranked, and the number of unique values is estimated. If the number of unique values is less than the number of percentiles, then the number of percentiles is reduced. The total number of values is divided by the number of percentiles. The limits of each interval are defined and two additional intervals are added to the minimum value and maximum value (<minimum value, >=maximum value).
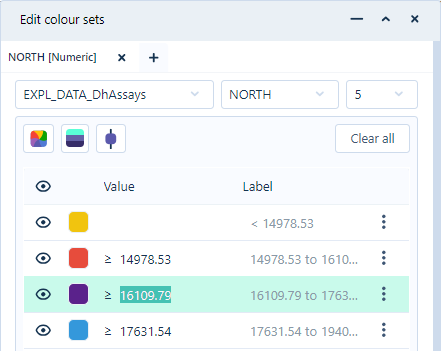
Edit Colour Sets
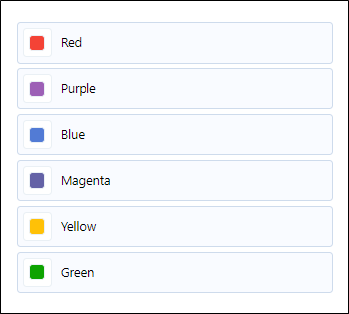
If no colours have been assigned, you can select the Colour field to assign a random colour set.

The Numeric codes displayed in the panel represent the interval depth range for the drillhole database. The available numeric intervals and their assigned colours for the selected field are displayed under Colour.
The Number of percentiles drop down is used to select the number of interval percentiles to be displayed in the drillhole model. For every percentile displayed, a colour can be assigned.

If you change the number of percentiles for displayed drillhole intervals, you will need to reassign a colour set for all of the available intervals.
The colour set for each numeric interval will be used to display that information in the drillhole model.
The colour for each numeric interval can be modified using the colour icon.
For information on using the colour selector, see Colour Coding.
If you toggle off the Visible icon for any numeric interval, that interval will be removed from display. Toggle the icon on to display the interval again.
You can toggle off the Visible icon in the panel header to hide all numeric intervals from display.
To make changes to an interval range, you can click inside the value and edit it directly.
If you want to use your own custom breakpoints for color coding based on any numeric field, you can manually enter them in the Edit Colour Set dialog.
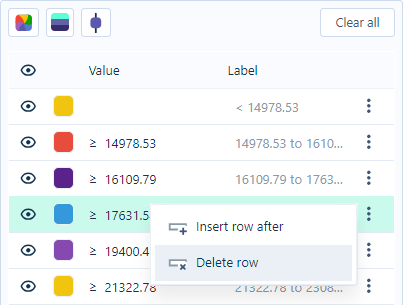
You can add numeric intervals using the Insert Row After option from the More menu for a code:
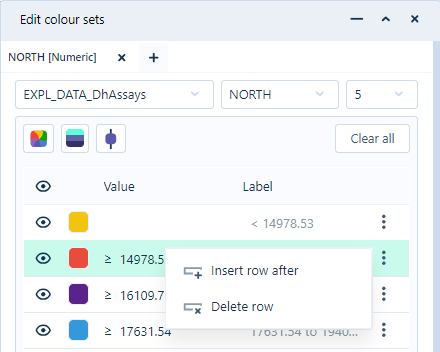
This will create a new line after the selected row in which you can enter the required information and set the colour. You can then save this colour set to the Scene so that your drillhole or point objects will retain the same color coding the next time you visualise them.
To remove a numeric interval, you can use the Delete Row option from the More menu for the code to be deleted.
The Clear All button will remove all intervals from the colour set.
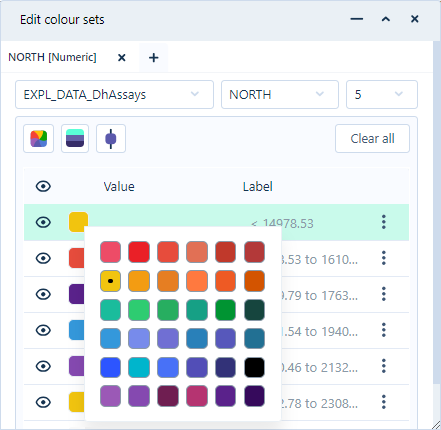
You can apply a random colour to each numeric interval using the Colour  button.
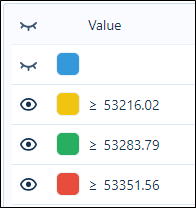
Note: Applying a random colour to intervals will limit the colours selected to a small set of primary colours:
 button. This will assign the graduated colours for each code in the drillhole data, using the colour for the first code and the colour for the last code for reference:
You can make changes to any of these colours using the Colour icon for each code. If you change the colour for the first or last codes and then reapply the Ramp Colours option, a new range will be applied to the remaining codes.
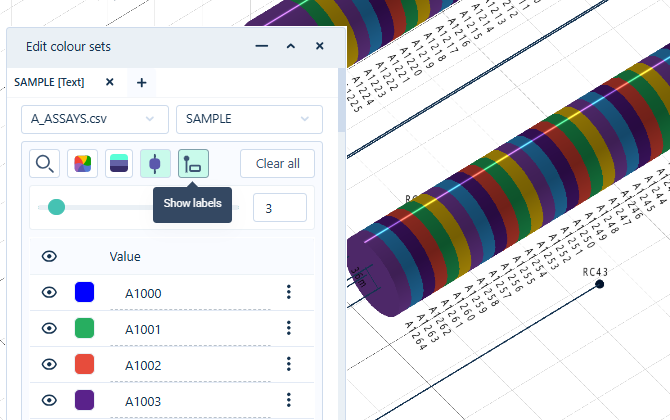
The Solid View  button provides solid trace visualisation of the drillholes in the Viewer.
Solid traces show colour-coded downhole data or specific numerical ranges and character codes. Drillholes are displayed in a 3D view in the same manner as the Solid trace Vizex layer in Micromine Origin & Beyond with the default parameters.
When toggled ON, the Solid Trace button activates the Solid Trace Radius slider. Using the slider, or entering a value in the field provided, you can determine the displayed radius of the solid trace to a maximum value of 50:

You can toggle Solid View OFF by clicking the button again.
The Show Labels button toggles the display of the drillhole interval labels for the displayed data. When the button is selected, any drillhole labels in the interval file will be displayed in the viewer for each interval: