Assign
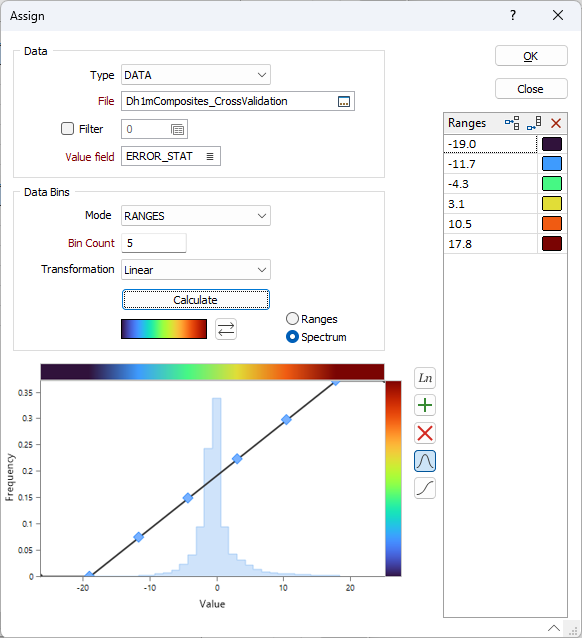
The Assign function used with numeric sets automatically divides your data into a specified number of ranges based upon the minimum and maximum values of a nominated field and the Calculation mode you have chosen. A histogram shows the ranges and a count of the values in each range bin.
Click on the Assign button in the Numeric Sets form to display the Assign dialog.
Data
Type and File inputs may be auto-filled depending on where the Edit Numeric Sets form is called from.
Type
Accept the default or select a file type. In addition to Micromine Origin & Beyond data files (including ODBC and MDB link files), you can select a generic CAD/GIS option (which includes proprietary file types such as Map Info, Arcview, and Microstation etc.). You can also specify a WIREFRAME type. Each wireframe type is stored in its own triangulation database (*.tridb) file.
File
Enter (or double-click to select) the file that contains the values you wish to base numeric ranges on. Where applicable, the option to apply a filter to the data is provided.
Name
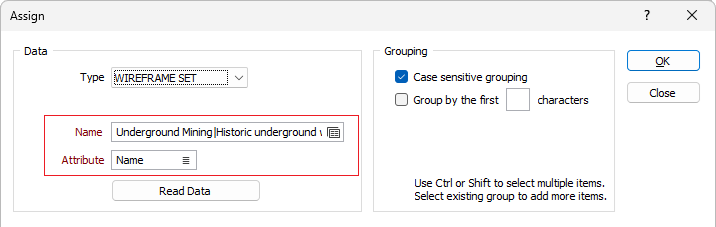
If you selected WIREFRAME SET as the Data Type, click on the Forms icon to select the Name of a wireframe set. Choose an attribute to assign the values of.
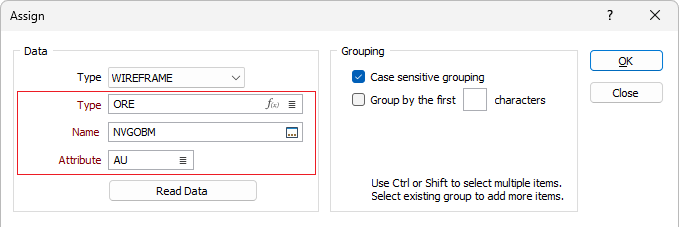
If you selected WIREFRAME as the Data Type, double-click (or click on the List icon) to select the Name of a wireframe of the specified wireframe type. Wildcards and a partial name in the Name input box may be used to select multiple wireframes. Choose an attribute to assign the values of.
Value field
Double-click to select the field in the file that contains the numeric values you want to use.
Data Bins
Choose the mode of calculation:
Mode
| Mode | Description |
|---|---|
|
RANGES |
The data will be divided into equal ranges. |
|
PERCENTILE (ADAPTIVE) |
The application will perform a PERCENTILE calculation (as below) however the number of bins is adapted to take into account duplicate values. |
|
PERCENTILE |
The application will divide the data into bins each containing the same number of values; the highest and lowest value in each bin will define the upper and lower range values for each bin. |
|
STATISTICAL |
If you select Statistical assignment in colour numeric sets, the mean and standard deviation of the data are calculated and 12 bins are established. |
|
JENKS |
A K-Means algorithm is used to divide the data into bins. The method seeks to reduce the variance within each bin range and maximise the variance between the bins. |
Bin Count
Enter the number of bins (ranges) you want to divide the data into.
In the Numeric Colour Sets form, a row number column (the left-most column in the grid list) makes it easier to determine the number of ranges in a set. The first and last row numbers in each list are left blank because they represent open-ended ranges that do not apply to the Assign process.
When you choose STATISTICAL for the mode of calculation, the number of ranges is fixed at 12. In this case, the Bin Count prompt is disabled.
Transformation/Distribution
If you choose STATISTICAL as the mode of calculation, a Distribution list is enabled. If you set this to LOG NORMAL, the natural logs of the values will be taken before they are distributed into the 12 unequal ranges. See: Log-normal limits
Setting it to NORMAL will mean that the raw values are used. See: Normal Limits
Ranges or Spectrum
Select the RANGES option to apply the colours as shown in the form. Select the SPECTRUM option to subdivide each range into eight equal parts, each with its own interpolated (or ramped) colour. This ensures that the colour coding is applied much more smoothly in the display.
The difference between the two is evident in the displayed palette, which is refreshed when you change options.
When editing a numeric colour set, if a NULL colour is encountered when in Spectrum mode, a warning is displayed and the mode is changed to Range mode.
Calculate
Click Calculate to calculate the data bins based on the Data Bins parameters you have specified.
Once the Ranges or the Spectrum have been calculated, you can click and drag the mouse to change the curve between the specified ranges/spectrum and the palette. The palette you have chosen is shown vertically at the right of the chart. The colour band that runs horizontally above the chart shows how the range/spectrum will look based upon the colours you have chosen.
X and Y labels are shown when moving a control point. X labels show the field values, while Y labels show values between 0 and 1, with 0.5 falling in the middle of the palette. Note that these Y scale labels match the cumulative frequency and do not match the histogram frequency shown along the Y axis.
Use the following tools to manipulate graph:
|
|
Toggle Natural Log Scaling. |
|
|
Add control point(s) to the chart.1 |
|
|
Remove control point(s) from the chart.1 |
|
|
Show or hide the Frequency series. |
|
|
Show or hide the Cumulative Frequency series. |
1Note that choosing to Add or Remove a control point puts the chart into Add or Remove mode. Right-click or click the Add/Remove button again to exit the corresponding mode. You can also double-click to add a control point or hold down the CTRL key as you select a point to remove it.
Ranges
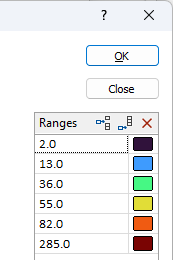
A preview of the calculated ranges are shown on the right-hand side of the form. Initially, these are the are the range values and colours shown in the Numeric Colour Sets form (if any). If necessary, use the Insert row and Append row buttons to modify the displayed ranges.
As you change the parameters in the Assign form and interact with the frequency chart, the colours and values assigned to the ranges are updated automatically.
OK
When you click OK, the Assign process will divide your data into the specified number of bins or ranges, using the Calculation mode you have selected and as shown in the Ranges preview.