Viewing the diagram
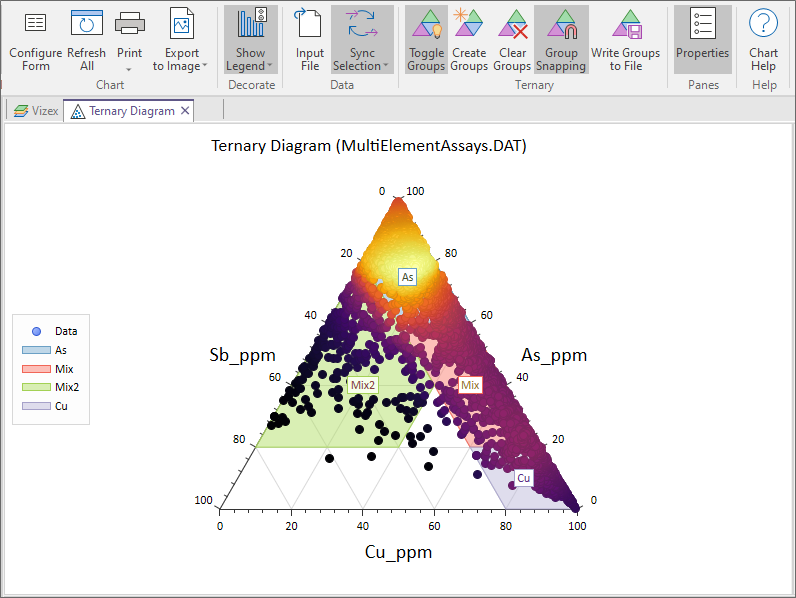
The Ternary Diagram uses data from three fields to construct a triangular graph in which the position of each point is determined by the ratio (percentage) of the three components.
Points may be interactively selected and grouped using tools on the Chart | Ternary Diagram ribbon:
When you generate a chart, many of the tools and options on the Chart ribbon are common to most charts. See: Chart Tools
Other tools on the Chart toolbar are specific to the type of chart displayed. In the Ternary Diagram, you can:
| Button | Description |
|---|---|
|
|
Toggle groups visibility. |
|
|
Select points to create a group. |
|
|
Clear all groups added to the diagram. |
|
|
Snap to grid when creating a group. |
|
|
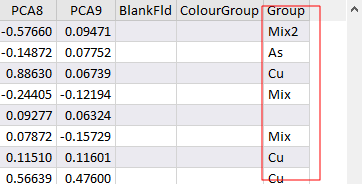
Write group labels to the Input file. If a group has no label it will not be written to the file. |
|
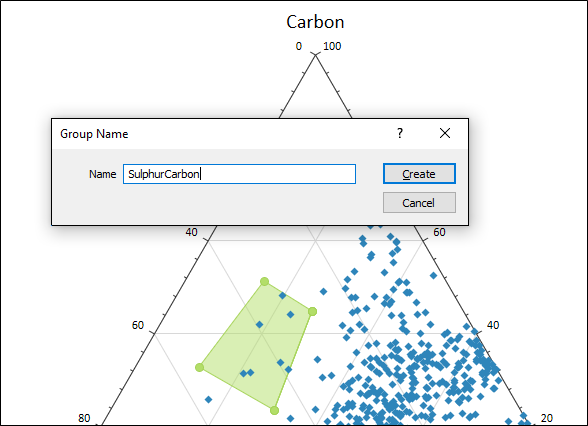
Create Group
- Optionally, enable the Snap to grid button before digitising the extents of your point selection.
![]()
- Click the Create Group button.
![]()
- Use the mouse to digitise an area which encompasses the points you want to group.