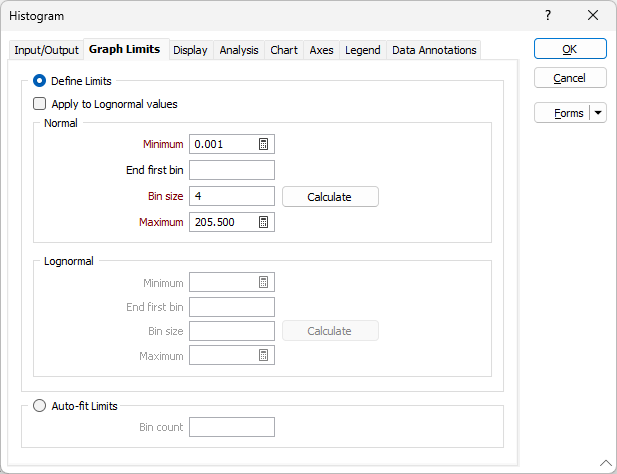
Graph Limits
The Graph Limits tab of the Histogram form is split into two halves. The options in the lower half apply to Lognormal (Natural Log) values.
Define Limits
Select this radio button to enable the options in the Normal group and configure the limits manually.
Apply to Lognormal values
The Apply to Lognormal values check box is only enabled when the Scale option on the Input tab of the form has been set to NATURAL LOG (Ln).
Select this option to define the limits of a graph that is using the natural logs of a data set. If this check box is not selected, the options in the Lognormal group of the Graph Limits tab are disabled.
Normal
Minimum
Enter the minimum value that will be shown on the graph. If the Graph scale is set to NATURAL LOG (Ln) the minimum value must be greater than zero.
End first bin
Enter a numeric value to define the end of the first bin (data range) on the display. Your entry should be based on your knowledge of the input data set.
Bin size
The bin size defines the interval between successive increments (the width of the bars) on the graph. If, for example, the bin size is set to 0.1 (with the first bin ending at 0.05), the boundaries will be at 0.15, 0.25, 0.35 and so on.
Enter a value or click the Calculate button to generate a bin size based on the other inputs.
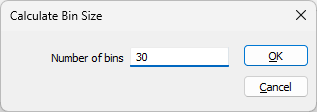
For detailed analysis, aim for around 50 bins. One rule of thumb for choosing the best bin size is to measure the range of the data (subtract the minimum value from the maximum value) and divide the result by 50. You may then use that value or round it to a simpler number.
Maximum
Enter the maximum value that will be shown on the graph. If you use the short cut method (double click or F3) to obtain a value, it will be adjusted automatically to ensure there is an integer number of bins.
Lognormal
Minimum
Enter the natural log value for the start of the graph. This value must be greater than 0.
End first bin
Enter the natural log value that defines the upper limit of the first bin.
Bin size
This input describes the size of each of the bins in the graph in terms of natural logs. Note natural logs (Ln) are logs to the base e. There may be up to 500 bins. Enter a value or click the Calculate button to calculate a bin size based on the other inputs.
Maximum
Enter the natural log of the maximum value that will be displayed on the graph.
Auto-fit Limits
Select this check box if you would like the application to automatically calculate the limits using the Bin Count value you enter.