Semi Variogram Model
When modelling, the primary objective is to select a model that most closely resembles the experimental semi-variogram you have created. Once you have done that, you can refine the characteristics of the model by changing its coefficients. Once satisfied with a match you save the model coefficients as a form set.
The Semi Variogram Model form can be opened by selecting Edit (F4) from the right-click menu in an Omindirectional or Directional Semi Variogram prompt, or via a Direction prompt (in Grid Create, Cross Validation, and Kriging).
All response boxes have spin controls associated with them and these provide a quick way of adjusting the values. The controls are set up to increment the increment value (change gear) over 10 consecutive increments by a factor of 10. You can therefore use these to quickly make both fine and coarse adjustments.
When a spin control has focus, you can use the mouse wheel to increase or decrease the displayed value.
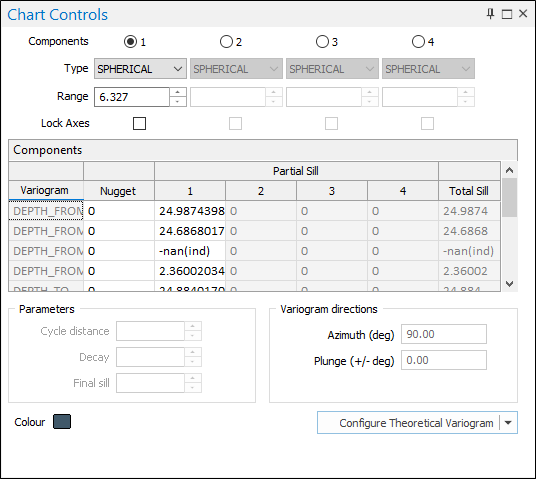
Number of components
Note that some semi variogram model types only allow one component to be defined. Where multiple components are allowed, the number of components can be set (or updated) and the associated range, partial sill, and model type can be entered for each component.
Type
The type of model should have a general shape which resembles the experimental semi variogram. See: Types of semi variogram model
Range
Enter the range of the components of the semi variogram model. The range is the distance where there ceases to be an identifiable relationship between sample pairs.
Note: If you are modelling cross variograms, the model type and the range value of each component is shared between the variograms you have defined in the Components grid (below). Interactively changing the range of a component in one graph will change it in all graphs.
Lock Axes
Optionally, use the check boxes to lock component sills across multiple axes (directions). When the sills are locked, all you need to do is adjust the ranges. Locking the sills doesn't just stop their values from changing, it also matches the sills of the other directions (in a 3D model) to whichever direction is active when you enable the option.
In other words, the nugget values of all three models are locked to the value of the current model.
Components
When multiple fields are specified, both direct (univariate) variograms and cross (multivariate) variograms are created. Use the buttons on the grid list toolbar to Manage the rows in the list.
Variogram
The data field(s) you have specified on the Input tab of the Semi Variograms form are listed in the Variogram column of the grid.
Nugget
For each variogram field, enter the Nugget value. The Nugget value (effect) is the variance at distance zero. This is always less than or equal to the sill. The nugget effect arises because the regionalized variable is erratic over a very short distance (less than the sampling interval).
Partial Sill
For each variogram field, enter the Y coordinate (semi variogram) value of the sill for each component of the model. This is constant for a dataset.
Total Sill
The total sill for each variogram model.
Note: Variogram parameters are normalised relative to 1 when Normalised Sills Mode is active. These parameters, such as nugget (proportion of the sill), can then be used in other normalised charts such as Correlograms.
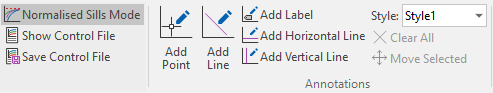
Normalised Sills Mode is automatically turned off when a normalised model form set is saved and then subsequently loaded.
Parameters
Slope / Cycle distance
For a Linear model enter the Slope of the line.
For a Hole Effect or Paddington Mix model, enter the Cycle distance (the distance between peaks and troughs).
Decay / Power
For a General Linear model enter a Power that will be used with the Slope to calculate a Range.
For Hole Effect or Paddington Mix variogram models, enter a damping factor. This is an inverse function - the smaller the factor the faster the damping.
Final Sill
Enter the Final sill. The Final Sill is the semi variogram (Y axis) value of the final or highest sill in multiple component variogram models.
Variogram Directions
Define the variogram direction by entering Azimuth and Plunge values. These values are used internally to define the model's Anisotropy.
If you are modelling cross (multivariate) variograms, the model for each direction is shown on all variograms. Interactive changes to one direction will change that direction for all the variograms defined in the Components grid.
Colour
Double-click on the icon to select a display colour for the semi-variogram model.
Configure Theoretical Variogram
Once you have refined the model's characteristics, save them as a form set. This form set will then be accessible in Gridding, Cross Validation, and the 3D Block Kriging functions.