Data Annotations
Use the Data Annotations grid to add point and line annotations and labels to the data on the chart.
Select an annotation type from the drop-down list. Use the buttons on the grid list toolbar to Manage the rows in the list.
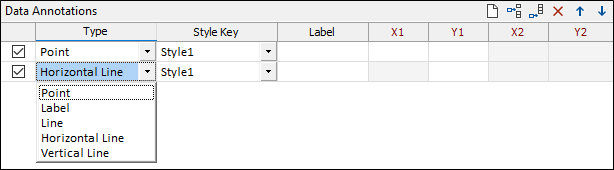
Each annotation has a style key that can be mapped to a style in the Data Annotation Styles grid.
Labels are optional. If the Label cell is left blank, no label will be added for that annotation. Click the Label font properties button (below the Data Annotation Styles grid) to set label font characteristics.
Note that you can double click on an annotation in the chart, to edit the Style and the Label of that annotation.
You can also move the label annotations on a chart by using the mouse to drag and drop them to a new position.
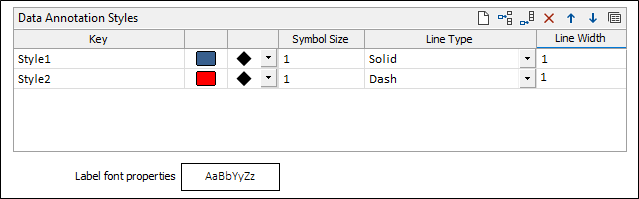
Data Annotation Styles
Use the Data Annotation Styles grid to associate styles with the annotations you have defined for the data in the chart.
Each new chart will have a default annotation style (with a default name of the form 'StyleN' where N is the row number starting from 1).
Each style in the grid has a style key that can be mapped to an annotation in the Data Annotation Styles grid.
Use the buttons on the grid list toolbar to Manage the rows in the list.
- Enter a style key name that indicates the type of annotation it should be applied to.
- Click on the icon to select a display colour.
- To set a point style, choose a marker symbol and specify a marker size.
- To set a line style, choose a line type and specify a line width.
- To set a generic style for both points and lines, follow steps 3 and 4.
Click the Forms button on the toolbar above the grid list, to save the styles you have defined as a form set. This allows styles to be easily shared between charts.
![]()
Interactively annotate the chart
The Data Annotations tab allows you to edit existing annotations. Initially, it is easier to create and position annotations interactively, while the chart is open, using the annotation tools on the Chart toolbar.
You can open and minimise the Chart form while you add annotations interactively.
- Click OK in the Chart form to generate the chart.
- Select the active Chart Annotation Style from the styles defined in the form. Annotations created interactively will use this style.
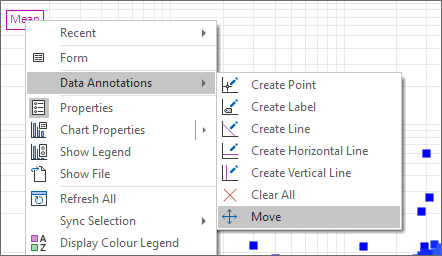
- Add annotations using the Annotation tools on the Chart tab:
- Click the Create Point tool to add a Point chart annotation
- Click the Create Label tool to add a Label chart annotation.
- Click the Create Line tool to add a Line chart annotation.
- Click the Create Horizontal Line tool to add a Horizontal Line chart annotation.
- Click the Create Vertical Line tool to add a Vertical Line chart annotation.
- As you left-click the mouse to position an annotation interactively, hold down the SHIFT key to continue to add successive annotations.
- If you are adding a line annotation, holding down the SHIFT key will enable you to define a polyline comprised of multiple line annotations (this is not the same as a polyline annotation). Press 'C' while digitising the “polyline” to close it.
- Click Move to move the selected annotation to a new position with the mouse and then click to drop into position.
- Select the annotation you want to move.
- Click the Move tool:
- Hold down the CTRL key as you use the mouse to reposition the annotation.
- Open the Chart form. You can then:
- Delete unwanted annotations (note that you cannot delete individual annotations interactively);
- Adjust the position of the annotations you have added interactively.
- Add new styles, edit existing styles, and associate styles with annotations.
- Click Apply to preview your changes without closing the Chart form.
![]()
![]()
![]()
![]()
![]()
To add multiple annotations in the same operation:
To move a copy of an annotation:
![]()
This will create a copy of the annotation you have selected, leaving the original annotation in its original position.